Climate and monthly weather forecastLos Angeles, CA
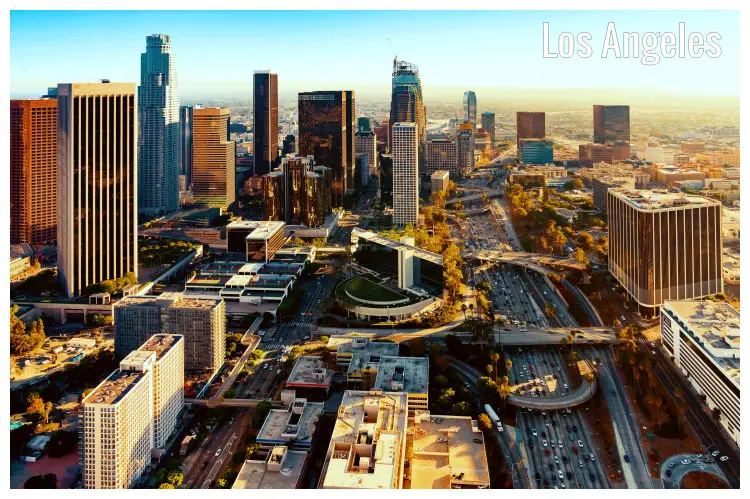
Climate and monthly weather forecast
The climate of Los Angeles
Characterized by a Mediterranean climate with warm summers, Los Angeles, California, adheres to the Köppen climate classification Csb. Flanked by the Pacific Ocean on one side and the Santa Monica Mountains on the other, this city experiences climate influences from both the cooler marine layer and the warmer terrestrial layer.Throughout the year, Los Angeles exhibits a relatively mild and sunny weather. Utilizing the provided data for climate parameters, a clear pattern emerges. High temperatures range from 64°F (17.8°C) in December to a peak of 83.3°F (28.5°C) in August. Simultaneously, low temperatures fluctuate moderately, reaching 50°F (10°C) in January and escalating up to 64.9°F (18.3°C) in August.
This spectacle of varying temperatures is accompanied by relatively modest changes in relative humidity, which swings between 50% in November and November and 65% in June. Despite being relatively dry, Los Angeles can experience rain, with rainfall totals spanning from as low as 0.04 in. in June to as high as 1.73 in. in February. Even so, these rainfalls tend to happen on a small number of days per month, generally between 1 in the driest month of July to 6.9 days in the wettest month of March.
Unique weather patterns emerge distinctively, showcasing a climate that is generally dry with maximum daylight hours and sunshine. In particular, April brings 13.1 daylight hours and June hails the maximum number of sunshine hours at 11.8. Interestingly, the city has a relatively constant visibility across the year, maintaining a distance of 6 miles.
The best time to visit Los Angeles
Taking into account the prevailing weather conditions, the best time to visit Los Angeles falls between April and October. During this period, the city witnesses the sunniest weather with maximum daylight hours. In April, visitors can enjoy a high temperature of 159.6°F (70.9°C) and low humidity of 58%. Furthermore, rainfall during these months is low, creating ideal conditions for sightseeing and outdoor activities.The worst time to visit Los Angeles
While Los Angeles boasts pleasant weather throughout the year, the period between November and January may not be the best time to visit. During this time, the city experiences moderate rainfall, with December recording the highest precipitation of 1.54 in., leaving the city's outdoors somewhat less inviting.Spring weather in Los Angeles
Spring in Los Angeles, from March to May, exhibits a mix of mild and slightly wet weather. High temperatures range from 68°F (20°C) in March to 72.9°F (22.7°C) in May. The rainfall totals decrease gradually from 1.22 in. in March to 0.24 in. in May, whilst the number of rainy days declines notably from 6.9 days in March to 3.7 days in May.Summer weather in Los Angeles
Los Angeles experiences its warmest weather between June and August. The summer months see high temperatures ranging from 76.6°F (24.8°C) to 83.3°F (28.5°C). June records a high relative humidity of 65%. Daylight hours peak at 14.4 hours in June, offering ample time for outdoor activities.Autumn weather in Los Angeles
Autumn, from September to November, is a dry season in Los Angeles with comfortable temperatures. High temperatures drop from 82.2°F (27.9°C) in September to 71.2°F (21.8°C) in November. Rainfall remains modest during this time, with values transitioning from 0.12 in. to 0.63 in.Winter weather in Los Angeles
Wintertime in Los Angeles, from December through February, offers moderate temperatures with highs ranging from 64°F (17.8°C) to 66°F (18.9°C). Rainfall is relatively higher during these months, peaking at 1.73 in. in February. Daylight hours reduce to around 10 hours while sunshine hours decline to roughly 6.8 hours in December. Despite this, winter months offer a unique charm in Los Angeles.Weather in January
The start of the year in Los Angeles, California, offers a gentle introduction, mainly dominated by mild temperatures and lower humidity. It is noteworthy that January has the lowest daylight hours of 10.2 hours among the twelve months, leading to shorter days and longer nights. Weather in January »Weather in February
The weather pattern of February trades continuity with January in terms of temperature and humidity. Los Angeles witnesses a slight increase in humidity levels during February, which may make the weather seem warmer than it is. Weather in February »Weather in March
The transition period between the winter season and spring settles during March, bringing a subtle change in weather conditions. There is a notable surge in the daylight duration to 12 hours in March compared to 11 hours in February. Weather in March »Weather in April
The city of Los Angeles, California, transitions fully into spring during April with marked changes in weather patterns. Weather characteristics of April reflect an impressive increase in daylight duration and a dip in rainfall quantities. Weather in April »Weather in May
Summer's prelude begins in May, with the weather in Los Angeles, California, seeing a significant rise in temperature. May displays an increase in daylight duration and a corresponding increment in the sunshine duration to 11.3 hours, contributing to warmer days. Weather in May »Weather in June
June ushers in the heart of summer in Los Angeles, California, with an associated increase in general temperature readings. The extended sunshine duration of 11.8 hours coupled with longer daylight periods result in warm and less humid days. Weather in June »Weather in July
Los Angeles, California, is in the thick of summer in July, mirroring climatic elements typical of this season. Despite the high temperatures and remarkable daylight duration, Los Angeles registers the lowest cloud coverage of 8% in July. Weather in July »Weather in August
August is the last complete summer month in Los Angeles, California, with high temperatures and plentiful sunshine. In unison with the summer trend, the UV index for August stays at 6, maintaining the call for the application of sunscreen. Weather in August »Weather in September
September in Los Angeles, California, observes a shift from the intense summer weather to the moderately warm autumn season. Despite the decrease in daylight hours, the average temperature refuses to lower significantly, keeping the days quite warm. Weather in September »Weather in October
Los Angeles, California, unmistakably eases into Autumn during October, with a noticeable reduction in temperature and a slight increase in rainfall. As the daylight hours retract further, the city moves away from the harsh summer climate towards a significantly calmer autumnal disposition. Weather in October »Weather in November
November brings the full swing of autumn to Los Angeles, California, with declining temperatures, increasing rainfall, and shorter daylight hours. The weather changes markedly as the days become colder and the nights longer, marking a departure from the summer and autumn seasons. Weather in November »Weather in December
The arrival of winter in Los Angeles, California, is evident in December, distinguished by colder temperatures, shorter daylight hours, and increased rainfall. A defining feature of December weather is an average rainfall becoming 1.54" (39mm), second only to February, bringing ample rain showers to the city. Weather in December »Published by: Weather U.S. | About Us
Data Sources | Weather Forecasting & Climate
Frequently asked questions
Average temperature
Los Angeles, CA
The warmest month (with the highest average high temperature) is August (28.5°C).
The month with the lowest average high temperature is December (17.8°C).
The month with the highest average low temperature is August (18.3°C).
The coldest month (with the lowest average low temperature) is February (9.9°C).
Average pressure
Los Angeles, CA
- Average pressure in January:
1019.4mbar - Average pressure in February:
1017.7mbar - Average pressure in March:
1017.1mbar - Average pressure in April:
1015mbar - Average pressure in May:
1013.5mbar - Average pressure in June:
1012.2mbar
- Average pressure in July:
1013.1mbar - Average pressure in August:
1012.5mbar - Average pressure in September:
1012.3mbar - Average pressure in October:
1014.2mbar - Average pressure in November:
1017mbar - Average pressure in December:
1018.4mbar
The month with the highest atmospheric pressure is January (1019.4mbar).
The month with the lowest atmospheric pressure is June (1012.2mbar).
Average wind speed
Los Angeles, CA
- Average wind speed in January:
8.6km/h - Average wind speed in February:
8.4km/h - Average wind speed in March:
8.9km/h - Average wind speed in April:
9.8km/h - Average wind speed in May:
9.3km/h - Average wind speed in June:
8.4km/h
- Average wind speed in July:
8km/h - Average wind speed in August:
7.6km/h - Average wind speed in September:
7.6km/h - Average wind speed in October:
7.3km/h - Average wind speed in November:
8km/h - Average wind speed in December:
8.4km/h
The windiest month (with the highest average wind speed) is April (9.8km/h).
The calmest month (with the lowest average wind speed) is October (7.3km/h).
Average humidity
Los Angeles, CA
The month with the highest relative humidity is June (65%).
The month with the lowest relative humidity is November (50%).
Average rainfall
Los Angeles, CA
The wettest month (with the highest rainfall) is February (44mm).
The driest month (with the least rainfall) is June (1mm).
Average rainfall days
Los Angeles, CA
- Average rainfall days in January:
5.2 days - Average rainfall days in February:
5.4 days - Average rainfall days in March:
6.9 days - Average rainfall days in April:
4.3 days - Average rainfall days in May:
3.7 days - Average rainfall days in June:
1 days
- Average rainfall days in July:
2.6 days - Average rainfall days in August:
1.5 days - Average rainfall days in September:
2.1 days - Average rainfall days in October:
2.5 days - Average rainfall days in November:
3.6 days - Average rainfall days in December:
5.8 days
The month with the highest number of rainy days is March (6.9 days).
The month with the least rainy days is June (1 days).
Average daylight / Average sunshine
Los Angeles, CA
- Average daylight in January:
10h and 12min - Average daylight in February:
11h and 0min - Average daylight in March:
12h and 0min - Average daylight in April:
13h and 6min - Average daylight in May:
13h and 54min - Average daylight in June:
14h and 24min
- Average daylight in July:
14h and 12min - Average daylight in August:
13h and 24min - Average daylight in September:
12h and 24min - Average daylight in October:
11h and 18min - Average daylight in November:
10h and 24min - Average daylight in December:
9h and 54min
The month with the longest days is June (Average daylight: 14h and 24min).
The month with the shortest days is December (Average daylight: 9h and 54min).
- Average sunshine in January:
6h and 48min - Average sunshine in February:
6h and 48min - Average sunshine in March:
8h and 48min - Average sunshine in April:
11h and 0min - Average sunshine in May:
11h and 18min - Average sunshine in June:
11h and 48min
- Average sunshine in July:
12h and 0min - Average sunshine in August:
12h and 0min - Average sunshine in September:
10h and 42min - Average sunshine in October:
8h and 24min - Average sunshine in November:
7h and 12min - Average sunshine in December:
6h and 42min
The months with the most sunshine are July and August (Average sunshine: 12h and 0min).
The month with the least sunshine is December (Average sunshine: 6h and 42min).
Average sunshine days
Los Angeles, CA
- Average sunshine days in January:
24.4 days - Average sunshine days in February:
21.7 days - Average sunshine days in March:
23.5 days - Average sunshine days in April:
25.6 days - Average sunshine days in May:
25.5 days - Average sunshine days in June:
27.8 days
- Average sunshine days in July:
26.9 days - Average sunshine days in August:
28.1 days - Average sunshine days in September:
26.8 days - Average sunshine days in October:
27.6 days - Average sunshine days in November:
25.3 days - Average sunshine days in December:
23.8 days
The month with the most sunshine days is August (28.1 days).
The month with the least sunshine days is February (21.7 days).
Average UV index
Los Angeles, CA
The months with the highest UV index are June, July, August and September (UV index 6).
The months with the lowest UV index are January, February, November and December (UV index 4).
Average cloud cover
Los Angeles, CA
The months with the most cloud cover are March and December (Cloud cover 22).
The month with the least cloud cover is August (Cloud cover 6).
Average visibility
Los Angeles, CA
The months with the highest visibility are January, February, March, April, May, June, July, August, September, October, November and December (10km).
The months with the lowest visibility are January, February, March, April, May, June, July, August, September, October, November and December (10km).


