August weather forecastValdez, AK
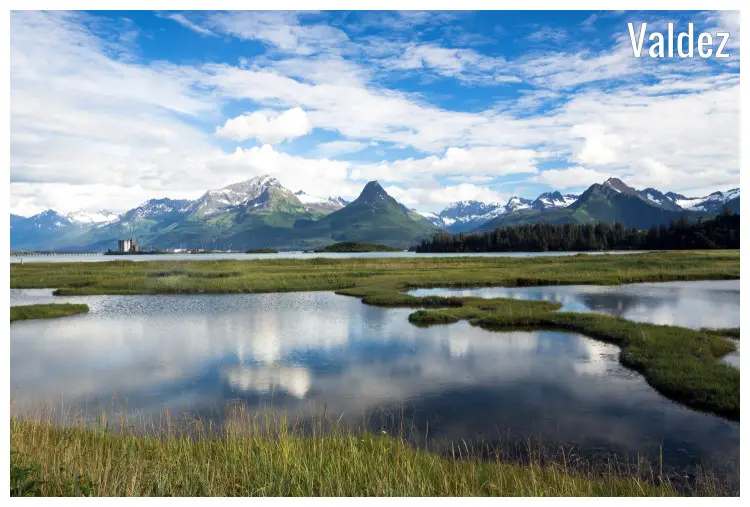
August
Weather in August
Although August signifies the end of summer, it still maintains some of July’s warmth with temperatures reaching to around 50.5°F (10.3°C). The city starts to transition from the warmth of summer towards the chill of autumn. More frequent showers remind the locals of the fast-approaching rainy season. Outdoor enthusiasts continue to enjoy their pursuits, albeit with a bit more rainfall. The town attends to its daily activities undeterred, embracing the changing season with enthusiastic spirit.Temperature
The beginning of August reveals an average high-temperature of a still cool 50.5°F (10.3°C), showing minimal deviation from the previous month. Throughout August, Valdez experiences a low-temperature average of 41.5°F (5.3°C).Humidity
The average relative humidity in August is 85%.Rainfall
In Valdez, in August, during 18.7 rainfall days, 4.09" (104mm) of precipitation is typically accumulated. In Valdez, during the entire year, the rain falls for 167.5 days and collects up to 56.73" (1441mm) of precipitation.Snowfall
June through August are months without snowfall.Ocean temperature
In August, the average ocean temperature is 55.8°F (13.2°C).Note: Swimming in 55.8°F (13.2°C) at temperatures under 50°F (10°C) requires thermal swimsuits; otherwise, one can face cold shock and breathing difficulty. Even brief immersion at 55.4°F (13°C) feels frosty.
Daylight
The average length of the day in August is 15h and 43min.On the first day of the month, sunrise is at 5:20 am and sunset at 10:22 pm. On the last day of August, sunrise is at 6:37 am and sunset at 8:53 pm AKDT.
Sunshine
In August, the average sunshine in Valdez is 8.1h.UV index
In August, the average daily maximum UV index is 2. A UV Index value of 2, and less, symbolizes a low threat to health from exposure to the Sun's UV radiation for the ordinary person.Note: In August, a daily UV index of 2 turns into the following recommendations:
Most people can stay in the Sun for up to 1 hour without burning, apart from children that always must be protected from sun exposure. Midday Sun has the strongest UV rays, making it crucial to limit exposure and find shade. Enhance your sun protection with tightly woven, yet airy clothing.
Published by: Weather U.S. | About Us
Data Sources | Weather Forecasting & Climate
Frequently asked questions
Average temperature in August
Valdez, AK
- Average high temperature in August: 50.5°F
The warmest month (with the highest average high temperature) is July (53.2°F).
The month with the lowest average high temperature is January (18°F).
- Average low temperature in August: 41.5°F
The month with the highest average low temperature is July (43.2°F).
The coldest month (with the lowest average low temperature) is January (10°F).
Average pressure in August
Valdez, AK
- Average pressure in August: 29.89"Hg
The month with the highest atmospheric pressure is July (29.98"Hg).
The month with the lowest atmospheric pressure is November (29.69"Hg).
Average wind speed in August
Valdez, AK
- Average wind speed in August: 3.9mph
The windiest month (with the highest average wind speed) is November (8.1mph).
The calmest month (with the lowest average wind speed) is July (3.7mph).
Average humidity in August
Valdez, AK
- Average humidity in August: 85%
The months with the highest relative humidity are January and April (88%).
The months with the lowest relative humidity are May, June, July and November (83%).
Average rainfall in August
Valdez, AK
- Average rainfall in August: 4.09"
The wettest month (with the highest rainfall) is December (7.44").
The driest month (with the least rainfall) is June (1.93").
Average rainfall days in August
Valdez, AK
- Average rainfall days in August: 18.7 days
The month with the highest number of rainy days is August (18.7 days).
The month with the least rainy days is February (6.2 days).
Average snowfall in August
Valdez, AK
- Average snowfall in August: 0"
The month with the highest snowfall is December (26.73").
The months with the least snowfall are June, July and August (0").
Average snowfall days in August
Valdez, AK
- Average snowfall days in August: 0 days
The month with the highest number of snowfall days is December (17.8 days).
The months with the least snowfall days are June, July and August (0 days).
Average sea temperature in August
Valdez, AK
- Average sea temperature in August: 55.6°F
The best month for swimming (with the highest average sea temperature) is July (56.4°F).
The coldest month (with the lowest average sea temperature) is March (38.9°F).
Average daylight in August /
Average sunshine in August
Valdez, AK
- Average daylight in August: 15h and 42min
The month with the longest days is June (Average daylight: 19h and 12min).
The month with the shortest days is December (Average daylight: 5h and 42min).
- Average sunshine in August: 8h and 6min
The month with the most sunshine is July (Average sunshine: 9h and 30min).
The month with the least sunshine is December (Average sunshine: 2h and 48min).
Average sunshine days in August
Valdez, AK
- Average sunshine days in August: 11.1 days
The months with the most sunshine days are January and May (12.3 days).
The month with the least sunshine days is December (9.7 days).
Average UV index in August
Valdez, AK
- Average UV index in August: 2
The months with the highest UV index are June and July (UV index 3).
The months with the lowest UV index are January and December (UV index 1).
Average cloud cover in August
Valdez, AK
- Average cloud cover in August: 54
The month with the most cloud cover is December (Cloud cover 58).
The month with the least cloud cover is July (Cloud cover 50).
Average visibility in August
Valdez, AK
- Average visibility in August: 5mi
The month with the highest visibility is June (6mi).
The months with the lowest visibility are January, February and April (4mi).


