Climate and monthly weather forecastPago Pago, AS
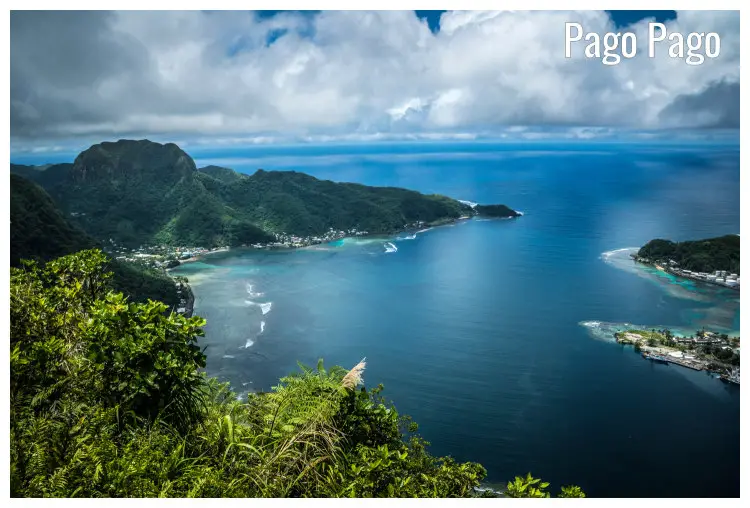
Climate and monthly weather forecast
The climate of Pago Pago
Pago Pago, given its geographical position in the Southern Pacific Ocean, experiences a Tropical rainforest climate (Often described as an Af classification in the Köppen climate classification system). Facing this climate, Pago Pago delivers consistent year-long temperatures, high levels of humidity, and sizeable rainfall throughout all months.Throughout the year, an examination of the temperature chart reflects minimum temperatures shifting from 79.3°F (26.3°C) to around 82.4°F (28°C), and maximum temperatures oscillating from 81.1°F (27.3°C) to 84°F (28.9°C). This verifies a relatively narrow temperature range, presenting the residents and visitants with a warm and tropical setting year-round.
Relative humidity remains consistently high during the entire year, ranging from 75% to 78%, which brings about a predominantly moist and humid atmosphere. The amount of rainfall is also considerable, accumulating from 1.77" (45mm) at the lowest point to a substantial 6.81" (173mm). Such consistent and substantial rainfall underscores the tropical rainforest climate.
A somewhat distinguishing element in Pago Pago's climate is the relatively constant levels of UV index at 7 throughout all months, suggesting a need for proper sun protection all year round. Concurrently, the wind speed fluctuates from a modest 8.6mph (13.8km/h) to a brisk 15.6mph (25.1km/h).
The best time to visit Pago Pago
Considering the climate parameters, the most appealing time to visit Pago Pago would be between the less rainy months of August, September followed by July, which sees an average rainfall of 2.05" (52mm), 1.77" (45mm), and 2.2" (56mm) respectively. Notably, wind speeds during these months are considerable, registering between 14.7mph (23.7km/h) and 15.6mph (25.1km/h), which could impart a refreshing balance to the tropical heat.The worst time to visit Pago Pago
Conversely, the least inviting months to visit Pago Pago might be January and February, harmonizing with the peak rainy season. Here, rainfall scales up to 6.81" (173mm) and 6.22" (158mm) respectively, accompanying the high humidity levels which could lead to a considerably clammy and wet experience.Spring weather in Pago Pago
Spring in Pago Pago, which spans from March to May, displays a gradual reduction in rainfall from 4.69" (119mm) to 4.84" (123mm). Simultaneously, the temperatures peak at 84°F (28.9°C) in April and then slightly cool down to 83.3°F (28.5°C) in May. Sea temperatures remain invitingly warm, hovering around 85.4°F (29.7°C) in March and descending marginally to 84.6°F (29.2°C) in May.Summer weather in Pago Pago
Pago Pago's summer season, from June to August, witnesses a noticeable drop in rainfall to a minimum 2.05" (52mm) in August. Coinciding with this is a slight drop in temperature, down to 81.5°F (27.5°C) at its lowest. Nevertheless, the sea temperature decreases slightly from 83.9°F (28.8°C) to 82°F (27.8°C) between June and August.Autumn weather in Pago Pago
Autumn in Pago Pago shows an increase in rainfall, ascending from 1.77" (45mm) in September to 3.98" (101mm) in November. Concurrent with this, temperatures remain reasonably stable, vacillating from 81.5°F (27.5°C) to 82.9°F (28.3°C). Sea temperatures begin to rise again reaching 84.5°F (29.2°C) by November.Winter weather in Pago Pago
Winter in Pago Pago, from December to February, is identified by abundant rainfall amounting to 6.81" (173mm) in January at its peak. Temperatures fluctuate from 81.9°F (27.7°C) to 83.1°F (28.4°C), while sea temperatures stabilize around 85°F (29.4°C). The wind speed also surges to 15.3mph (24.6km/h) in December, lending some coolness to the tropical heat.Weather in January
In January, Pago experiences mild weather with consistent conditions typical of American Samoa's tropical climate. The month sees a steady high temperature, while the low temperature remains comfortably warm. A notable factor in January's weather is the high amount of rainfall, measuring at 6.81" (173mm). Weather in January »Weather in February
The weather in February in Pago exhibits similar characteristics to January, but with slight changes. The average high and low temperatures slightly drop, along with reduced humidity levels. February is the month with the second-highest amount of rainfall, at 6.22" (158mm), making it one of the wettest months of the year. Weather in February »Weather in March
Moving onto March, the temperature in Pago begins to shift. While high temperatures remain relatively stable, the city sees a slight increase in low temperatures. March marks the beginning of a downward trend in rainfall, receiving only 3.94" (100mm), indicating a transition from rainy to dry period. Weather in March »Weather in April
April in Pago showcases a blend of weather conditions. While the average high temperature remains consistent, the low temperature shows a slight dip compared with March. The most significant climatic feature in April is an increased amount of rainfall at 4.69" (119mm). Weather in April »Weather in May
Come May, Pago sees a continuation of April's trends but with slight changes. The high temperature takes a downturn, while the low temperature holds steady. May's noticeable weather feature is the slight increase in rainfall, which stands at 4.84" (123mm). Weather in May »Weather in June
June heralds the onset of some noticeable changes in Pago's weather. Though the high temperature slightly decreases from May, the lower temperature drops considerably. June sees a substantial decrease in rainfall, receiving only 2.2" (56mm) in comparison with May. Weather in June »Weather in July
July in Pago presents a weather pattern similar to June but with certain exceptions. The high temperatures continue to dip, but the low temperatures see a substantial drop. Despite the ongoing dry period, July receives a slightly higher rainfall of 2.72" (69mm) than June. Weather in July »Weather in August
August registers little change in the weather patterns from July in Pago. While high temperatures remain stable, low temperatures see a slight increment. The rainfall in August is 2.05" (52mm), solidifying the continuation of the dry period. Weather in August »Weather in September
September brings minimal changes in the weather in Pago compared to August. The high temperature sees a minute rise, while the low temperature remains steady. Incredibly, September records the lowest rainfall of the year at 1.77" (45mm). Weather in September »Weather in October
October in Pago brings increased rainfall, measuring at 3.98" (101mm), marking a transition from a relatively dry to a wet period. Both the high and low temperatures see a rise from September. Though daylight hours continue to extend, the cloud coverage slightly increases. Weather in October »Weather in November
November's weather features in Pago include an increased level of rainfall, registering a considerable 4.84" (123mm). The high temperatures continue to climb, while the low temperature sees a noticeable boost. Even with less daylight hours compared to October, the sea temperature rises, providing ideal conditions for swimming and snorkeling. The advent of November presents an average high-temperature of a still warm 82.9°F (28.3°C), maintaining a close correlation with the preceding month. Weather in November »Weather in December
In December, Pago witnesses a further increase in rainfall, amounting to 5.91" (150mm), making it the wettest month of the year. The month also sees higher high and low temperatures. Despite the increase in rain, the sea temperature continues to be inviting for water activities. Weather in December »Published by: Weather U.S. | About Us
Data Sources | Weather Forecasting & Climate
Frequently asked questions
Average temperature
Pago Pago, AS
The warmest month (with the highest average high temperature) is April (84°F).
The month with the lowest average high temperature is August (81.1°F).
The month with the highest average low temperature is March (82.4°F).
The coldest months (with the lowest average low temperature) are July, August and September (79.3°F).
Average pressure
Pago Pago, AS
- Average pressure in January:
29.75"Hg - Average pressure in February:
29.77"Hg - Average pressure in March:
29.81"Hg - Average pressure in April:
29.84"Hg - Average pressure in May:
29.86"Hg - Average pressure in June:
29.88"Hg
- Average pressure in July:
29.89"Hg - Average pressure in August:
29.9"Hg - Average pressure in September:
29.91"Hg - Average pressure in October:
29.87"Hg - Average pressure in November:
29.83"Hg - Average pressure in December:
29.78"Hg
The month with the highest atmospheric pressure is September (29.91"Hg).
The month with the lowest atmospheric pressure is January (29.75"Hg).
Average wind speed
Pago Pago, AS
- Average wind speed in January:
10.2mph - Average wind speed in February:
10.9mph - Average wind speed in March:
8.6mph - Average wind speed in April:
10mph - Average wind speed in May:
11.7mph - Average wind speed in June:
15.3mph
- Average wind speed in July:
15.6mph - Average wind speed in August:
15.3mph - Average wind speed in September:
14.7mph - Average wind speed in October:
13mph - Average wind speed in November:
11mph - Average wind speed in December:
10.4mph
The windiest month (with the highest average wind speed) is July (15.6mph).
The calmest month (with the lowest average wind speed) is March (8.6mph).
Average humidity
Pago Pago, AS
The months with the highest relative humidity are June, July, August, September and October (78%).
The month with the lowest relative humidity is March (75%).
Average rainfall
Pago Pago, AS
- Average rainfall in January:
6.81" - Average rainfall in February:
6.22" - Average rainfall in March:
3.94" - Average rainfall in April:
4.69" - Average rainfall in May:
4.84" - Average rainfall in June:
2.2"
- Average rainfall in July:
2.72" - Average rainfall in August:
2.05" - Average rainfall in September:
1.77" - Average rainfall in October:
3.98" - Average rainfall in November:
4.84" - Average rainfall in December:
5.91"
The wettest month (with the highest rainfall) is January (6.81").
The driest month (with the least rainfall) is September (1.77").
Average rainfall days
Pago Pago, AS
- Average rainfall days in January:
25.8 days - Average rainfall days in February:
23.7 days - Average rainfall days in March:
26.1 days - Average rainfall days in April:
26 days - Average rainfall days in May:
24.4 days - Average rainfall days in June:
20.2 days
- Average rainfall days in July:
21.3 days - Average rainfall days in August:
20.8 days - Average rainfall days in September:
20 days - Average rainfall days in October:
23.3 days - Average rainfall days in November:
23.2 days - Average rainfall days in December:
25.2 days
The month with the highest number of rainy days is March (26.1 days).
The month with the least rainy days is September (20 days).
Average sea temperature
Pago Pago, AS
The best month for swimming (with the highest average sea temperature) is March (85.4°F).
The coldest months (with the lowest average sea temperature) are August and September (82°F).
Average daylight / Average sunshine
Pago Pago, AS
- Average daylight in January:
12h and 54min - Average daylight in February:
12h and 36min - Average daylight in March:
12h and 12min - Average daylight in April:
11h and 48min - Average daylight in May:
11h and 24min - Average daylight in June:
11h and 18min
- Average daylight in July:
11h and 24min - Average daylight in August:
11h and 42min - Average daylight in September:
12h and 0min - Average daylight in October:
12h and 24min - Average daylight in November:
12h and 48min - Average daylight in December:
13h and 0min
The month with the longest days is December (Average daylight: 13h and 0min).
The month with the shortest days is June (Average daylight: 11h and 18min).
- Average sunshine in January:
7h and 42min - Average sunshine in February:
7h and 54min - Average sunshine in March:
8h and 30min - Average sunshine in April:
8h and 12min - Average sunshine in May:
7h and 54min - Average sunshine in June:
7h and 36min
- Average sunshine in July:
7h and 12min - Average sunshine in August:
7h and 24min - Average sunshine in September:
7h and 48min - Average sunshine in October:
8h and 48min - Average sunshine in November:
9h and 30min - Average sunshine in December:
9h and 42min
The month with the most sunshine is December (Average sunshine: 9h and 42min).
The month with the least sunshine is July (Average sunshine: 7h and 12min).
Average sunshine days
Pago Pago, AS
- Average sunshine days in January:
3.3 days - Average sunshine days in February:
3.2 days - Average sunshine days in March:
3.8 days - Average sunshine days in April:
2.3 days - Average sunshine days in May:
4.6 days - Average sunshine days in June:
5.3 days
- Average sunshine days in July:
5 days - Average sunshine days in August:
5.9 days - Average sunshine days in September:
6.1 days - Average sunshine days in October:
3.9 days - Average sunshine days in November:
4.5 days - Average sunshine days in December:
3.9 days
The month with the most sunshine days is September (6.1 days).
The month with the least sunshine days is April (2.3 days).
Average UV index
Pago Pago, AS
The months with the highest UV index are January, February, March, April, May, June, July, August, September, October, November and December (UV index 7).
The months with the lowest UV index are January, February, March, April, May, June, July, August, September, October, November and December (UV index 7).
Average cloud cover
Pago Pago, AS
The month with the most cloud cover is July (Cloud cover 49).
The month with the least cloud cover is March (Cloud cover 40).
Average visibility
Pago Pago, AS
The months with the highest visibility are January, February, March, April, May, June, July, August, September, October, November and December (6mi).
The months with the lowest visibility are January, February, March, April, May, June, July, August, September, October, November and December (6mi).


