January weather forecastBurbank, CA
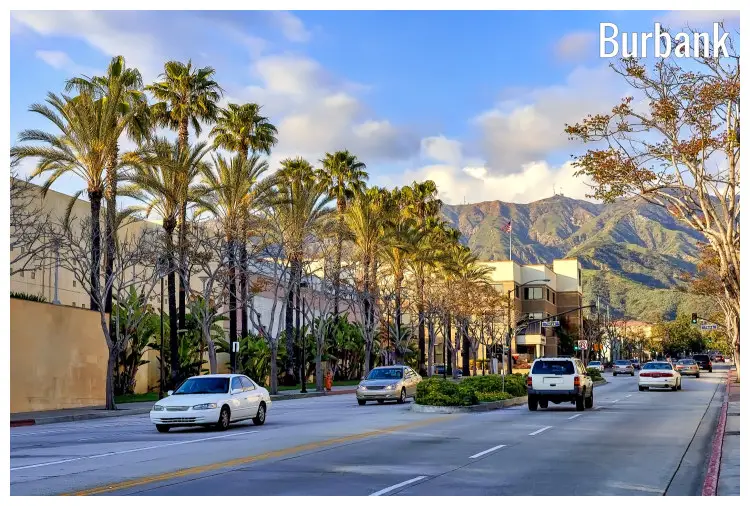
January
Weather in January
The new year in Burbank, California, opens with temperatures averaging at a comfortable 63.5°F (17.5°C) during the days and dipping to around 47.5°F (8.6°C) at night. A fair amount of rainfall occurs, particularly compared to the following months, adding a refreshing touch to the dry Californian air. Visibility is generally clear, allowing for unobstructed views throughout the city. The atmosphere stays pleasant with a moderate level of humidity, fostering comfort through the wintry chills. A combination of moderate pressure and wind speeds adds to the overall serenity of the weather.Temperature
The arrival of January in Burbank denotes a barely perceptible change in the average high-temperatures to a still refreshing 63.5°F (17.5°C) from December's 61.7°F (16.5°C). Burbank records an average temperature drop to a frosty 47.5°F (8.6°C) in January.Humidity
In January, the average relative humidity in Burbank is 52%.Rainfall
In Burbank, in January, it is raining for 4.1 days, with typically 0.94" (24mm) of accumulated precipitation. Throughout the year, there are 40.1 rainfall days, and 5.87" (149mm) of precipitation is accumulated.Daylight
In January, the average length of the day in Burbank is 10h and 11min.On the first day of the month, sunrise is at 6:59 am and sunset at 4:54 pm. On the last day of January, in Burbank, sunrise is at 6:51 am and sunset at 5:22 pm PST.
Sunshine
January, February and December, with an average of 6.9h of sunshine, are months with the least sunshine in Burbank, California.UV index
The average daily maximum UV index in January is 4. A UV Index estimate of 3 to 5 represents a moderate threat to health from unsafe exposure to UV radiation for the ordinary person.Note: A daily high UV index of 4 in January leads to these guidelines:
Undertake protective steps - Obligation to safeguard skin and eyes from harm is in place. The solar radiation is most powerful near the mid-day, so the exposure to the direct Sun should be reduced accordingly. Clothes that are both tight-knit and comfortably loose are prime choices for sun protection.
Published by: Weather U.S. | About Us
Data Sources | Weather Forecasting & Climate
Frequently asked questions
Average temperature in January
Burbank, CA
- Average high temperature in January: 63.5°F
The warmest month (with the highest average high temperature) is August (86.5°F).
The month with the lowest average high temperature is December (61.7°F).
- Average low temperature in January: 47.5°F
The month with the highest average low temperature is August (64.8°F).
The coldest month (with the lowest average low temperature) is December (46.2°F).
Average pressure in January
Burbank, CA
- Average pressure in January: 30.11"Hg
The month with the highest atmospheric pressure is January (30.11"Hg).
The month with the lowest atmospheric pressure is June (29.88"Hg).
Average wind speed in January
Burbank, CA
- Average wind speed in January: 5.7mph
The windiest month (with the highest average wind speed) is April (5.9mph).
The calmest month (with the lowest average wind speed) is September (4.4mph).
Average humidity in January
Burbank, CA
- Average humidity in January: 52%
The month with the highest relative humidity is June (59%).
The month with the lowest relative humidity is November (48%).
Average rainfall in January
Burbank, CA
- Average rainfall in January: 0.94"
The wettest month (with the highest rainfall) is December (1.18").
The driest month (with the least rainfall) is June (0.04").
Average rainfall days in January
Burbank, CA
- Average rainfall days in January: 4.1 days
The month with the highest number of rainy days is March (5.2 days).
The month with the least rainy days is June (1 days).
Average daylight in January /
Average sunshine in January
Burbank, CA
- Average daylight in January: 10h and 12min
The month with the longest days is June (Average daylight: 14h and 24min).
The month with the shortest days is December (Average daylight: 9h and 54min).
- Average sunshine in January: 6h and 54min
The months with the most sunshine are June, July and August (Average sunshine: 12h and 6min).
The months with the least sunshine are January, February and December (Average sunshine: 6h and 54min).
Average sunshine days in January
Burbank, CA
- Average sunshine days in January: 25.9 days
The month with the most sunshine days is October (27.1 days).
The month with the least sunshine days is February (22.9 days).
Average UV index in January
Burbank, CA
- Average UV index in January: 4
The months with the highest UV index are June, July, August and September (UV index 6).
The month with the lowest UV index is December (UV index 3).
Average cloud cover in January
Burbank, CA
- Average cloud cover in January: 20
The months with the most cloud cover are March and December (Cloud cover 21).
The month with the least cloud cover is August (Cloud cover 4).
Average visibility in January
Burbank, CA
- Average visibility in January: 6mi
The months with the highest visibility are January, February, March, April, May, June, July, August, September, October, November and December (6mi).
The months with the lowest visibility are January, February, March, April, May, June, July, August, September, October, November and December (6mi).


