Climate and monthly weather forecastSanta Barbara, CA
Santa Barbara, California, USA - Climate and weather forecast by month. Detailed climate information with charts - average monthly weather with temperature, pressure, humidity, precipitation, wind, daylight, sunshine, visibility, and UV index data. Winter months in Santa Barbara, from December through February, display the lowest temperatures of the year, declining to around 47.7°F (8.7°C). Alongside this, Santa Barbara experiences higher rainfall levels amounting to 1.34" (34mm) and sees diminished sunshine, having the minimum duration of about 6.8 hours.
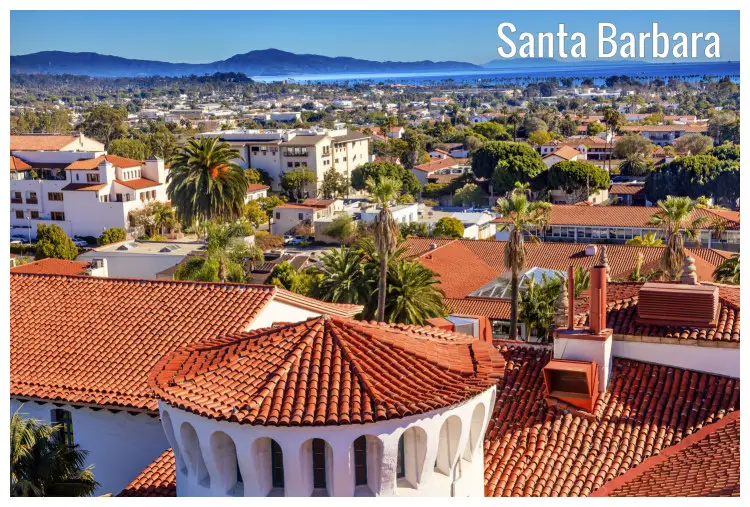
Climate and monthly weather forecast
The climate of Santa Barbara
Santa Barbara, found in California, USA, is enveloped by a Mediterranean, warm summer climate type, referred to as 'Csb' in the Köppen climate classification. Valued for its mild and moderate conditions, Santa Barbara's climate presents relatively stable weather shifts throughout a typical calendar year. Across the year, the temperature fluctuates from a low of 47.7°F (8.7°C) to a high of 79.2°F (26.2°C). Rainfall sees variations between as little as 0.08" (2mm) in the dry months to 1.57" (40mm) in the more humid periods, with relative humidity spanning from 56% to 64%.Notable transitions are seen in other weather elements. Annual average daylight duration swings from 9.9 hours to a high of 14.4 hours, while sunshine duration is observed from 6.8 hours to a peak of 12 hours. Perceived temperature spikes are in summer with sea temperatures reaching up to 62.2°F (16.8°C). The wind maintains a mild range of 5.6mph (9km/h) to 8.1mph (13km/h), with gusts that can reach up to 12.9mph (20.8km/h).
A unique weather pattern is the minimal rainfall experienced during the summer season. Also, from December to February, temperatures drop significantly with the lowest point reaching 47.7°F (8.7°C), a stark contrast to the warmer months of the year.
The best time to visit Santa Barbara
For visitors seeking to maximize their time outdoors, the optimal time to stop by Santa Barbara would be between June and September. During this period, the city enjoys the most daylight, with durations averaging 14.2 hours. Sea temperatures also peak during this period, making it ideal for beach activities. These months typically coincide with the lowest average rainfall of 0.16" (4mm), reducing chances of plans being spoiled by showers. Furthermore, these months have a near-maximum sunshine duration of about 12 hours, providing ample daylight for sightseeing and other outdoor activities.The worst time to visit Santa Barbara
Visitors averse to cold and rainy conditions might find the period from December to February less appealing for travel. During these months, the city records the lowest temperatures, going down to 47.7°F (8.7°C) and has less daylight with a minimum of 9.9 hours on average. Alongside this, Santa Barbara experiences higher rainfall levels amounting to 1.34" (34mm) and sees diminished sunshine, having the minimum duration of about 6.8 hours.Spring weather in Santa Barbara
Spring in Santa Barbara, from March to May, ushers in warming temperatures and the celebration of floral blooms. The average highs range from 61.3°F (16.3°C) in March to 69.4°F (20.8°C) in May. The corresponding low temperatures range from 48.7°F (9.3°C) to 53.1°F (11.7°C). The increasing hours of sunshine from 8.9 hours to 11.7 hours on average also exemplify the arrival of warm spring days. Wind speeds average 7.6mph (12.2km/h) to 8mph (12.9km/h), bringing cool breezes over the period.Summer weather in Santa Barbara
Summer, from June to August, offers the warmest temperatures in Santa Barbara. The values range from a peak of 79.2°F (26.2°C) and descend to a comforting 56.8°F (13.8°C). Minimal rainfall coupled with the increased average daylight hours of 14.2 hours in July makes for a delightful season. Alongside this, the city experiences the peak sea temperatures of 62.1°F (16.7°C) to 62.2°F (16.8°C), making it an ideal time for beach visits and water activities.Autumn weather in Santa Barbara
Autumn arrives in September and carries on through November, with temperatures gradually decreasing. The high temperature transitions from a high of 77.4°F (25.2°C) in September to a lower 66.9°F (19.4°C) towards November. Average low temperatures show similar decline from 61.7°F (16.5°C) to 52.7°F (11.5°C). During this period, there is a minimal increase in rainfall from 0.12" (3mm) to 0.51" (13mm). The wind also strengthens slightly from 6.2mph (10km/h) to 6.4mph (10.3km/h) in November.Winter weather in Santa Barbara
Winter months in Santa Barbara, from December through February, display the lowest temperatures of the year, declining to around 47.7°F (8.7°C). Despite this, the city doesn't witness severe winters and remains fairly mild throughout. Average daylight hours reach a minimum of 9.9 hours in December, indicative of the shorter winter days. Notably, this is the period when Santa Barbara encounters the most rainfall, with levels reaching up to 1.34" (34mm) in December. Moreover, it happens to be the period of increased wind speeds whirling up to 7.1mph (11.4km/h).Weather in January
The beginning of the year in Santa Barbara, California, is marked by comparatively mild winter conditions with an average high of 62.2°F (16.8°C) and a low of 48.7°F (9.3°C). Humidity levels hover around the 59% mark and daylight is roughly 10.2 hours. Weather in January »Weather in February
The weather in February continues along a similar trajectory as January, although with a slight downturn in temperature, dropping to an average high of 61.3°F (16.3°C) and low of 47.7°F (8.7°C). Relative humidity generally increases to around 62%, while rainfall measures close to 1.38" (35mm). Weather in February »Weather in March
March in Santa Barbara witnesses a gradual change towards warmer days, albeit with a higher number of rainy days at 7.3 days. The average high this month is typically around 63.1°F (17.3°C) while lows average at 48.7°F (9.3°C). Weather in March »Weather in April
The month of April is characterized by slightly warmer temperatures with average highs reaching 66.7°F (19.3°C) while lows stabilize around 50.4°F (10.2°C). Rainfall in April takes a strong dip from March, sliding down to a monthly average of 0.55" (14mm). Weather in April »Weather in May
May marks the beginning of comfortable, sunny weather conditions in Santa Barbara. With average temperatures ranging between 69.4°F (20.8°C) and 53.1°F (11.7°C), it suits outdoor activities. Recorded rainfall drops to the year's lowest at 0.16" (4mm), striking a stark contrast to the previous months. Weather in May »Weather in June
In June, Santa Barbara residents enjoy the onset of summer, characterized by high temperatures of 73.9°F (23.3°C) and lows of 56.8°F (13.8°C). June sees a marginal increase in daily sunshine to 12 hours, making it one of the sunniest months of the year. Weather in June »Weather in July
July stands out as the warmest month in Santa Barbara, with an average high temperature soaring to 78.1°F (25.6°C) and a low of 61.2°F (16.2°C). Corresponding to high temperatures, the sea temperature hits its peak too, averaging 62.1°F (16.7°C). Weather in July »Weather in August
Although temperatures in August drop slightly from July, reaching an average high of 79.2°F (26.2°C) and low of 62.1°F (16.7°C), it remains one of Santa Barbara's hottest months. Taking advantage of the warm temperatures, tourists often flock to the beaches. Weather in August »Weather in September
With the arrival of September, Santa Barbara witnesses a slight dip in temperature to an average high of 77.4°F (25.2°C) and low of 61.7°F (16.5°C). Humidity slightly dips down to 56%, and the city sees around 0.12" (3mm) of rain - a similar picture to the preceding summer months. Weather in September »Weather in October
The month of October brings a noticeable change, with a decreased average high temperature of 72.9°F (22.7°C) and a low of 57.7°F (14.3°C). While the rainfall increases slightly to 0.2" (5mm), the city moves towards cooler evenings. Weather in October »Weather in November
November marks a significant drop in temperature, signifying the approach of winter, with the average high temperature declining to 66.9°F (19.4°C) and the low to 52.7°F (11.5°C). The city receives slightly more rainfall, measuring up to 0.51" (13mm) typically over 3.2 days, indicating the onset of the city's wettest period. Weather in November »Weather in December
December in Santa Barbara sees the full arrival of winter, marked by the year’s lowest average temperatures with a high of 60.6°F (15.9°C) and a low of 48.6°F (9.2°C). This is also the wettest month of the year, with rainfall reaching up to 1.34" (34mm) over the course of 5.7 days. Weather in December »Published by: Weather U.S. | About Us
Data Sources | Weather Forecasting & Climate
Frequently asked questions
Average temperature
Santa Barbara, CA
The warmest month (with the highest average high temperature) is August (79.2°F).
The month with the lowest average high temperature is December (60.6°F).
The month with the highest average low temperature is August (62.1°F).
The coldest month (with the lowest average low temperature) is February (47.7°F).
Average pressure
Santa Barbara, CA
- Average pressure in January:
30.11"Hg - Average pressure in February:
30.06"Hg - Average pressure in March:
30.05"Hg - Average pressure in April:
30"Hg - Average pressure in May:
29.96"Hg - Average pressure in June:
29.91"Hg
- Average pressure in July:
29.93"Hg - Average pressure in August:
29.91"Hg - Average pressure in September:
29.91"Hg - Average pressure in October:
29.96"Hg - Average pressure in November:
30.04"Hg - Average pressure in December:
30.08"Hg
The month with the highest atmospheric pressure is January (30.11"Hg).
The months with the lowest atmospheric pressure are June, August and September (29.91"Hg).
Average wind speed
Santa Barbara, CA
- Average wind speed in January:
6.5mph - Average wind speed in February:
7.1mph - Average wind speed in March:
7.6mph - Average wind speed in April:
8.1mph - Average wind speed in May:
8mph - Average wind speed in June:
6.4mph
- Average wind speed in July:
5.6mph - Average wind speed in August:
5.7mph - Average wind speed in September:
6.2mph - Average wind speed in October:
6.3mph - Average wind speed in November:
6.4mph - Average wind speed in December:
6.6mph
The windiest month (with the highest average wind speed) is April (8.1mph).
The calmest month (with the lowest average wind speed) is July (5.6mph).
Average humidity
Santa Barbara, CA
The month with the highest relative humidity is March (64%).
The months with the lowest relative humidity are September, October and November (56%).
Average rainfall
Santa Barbara, CA
- Average rainfall in January:
1.57" - Average rainfall in February:
1.38" - Average rainfall in March:
1.46" - Average rainfall in April:
0.55" - Average rainfall in May:
0.16" - Average rainfall in June:
0.08"
- Average rainfall in July:
0.24" - Average rainfall in August:
0.08" - Average rainfall in September:
0.12" - Average rainfall in October:
0.2" - Average rainfall in November:
0.51" - Average rainfall in December:
1.34"
The wettest month (with the highest rainfall) is January (1.57").
The driest months (with the least rainfall) are June and August (0.08").
Average rainfall days
Santa Barbara, CA
- Average rainfall days in January:
5.3 days - Average rainfall days in February:
5.6 days - Average rainfall days in March:
7.3 days - Average rainfall days in April:
4.7 days - Average rainfall days in May:
2.4 days - Average rainfall days in June:
1.2 days
- Average rainfall days in July:
3.3 days - Average rainfall days in August:
1.3 days - Average rainfall days in September:
1.9 days - Average rainfall days in October:
1.8 days - Average rainfall days in November:
3.2 days - Average rainfall days in December:
5.7 days
The month with the highest number of rainy days is March (7.3 days).
The month with the least rainy days is June (1.2 days).
Average sea temperature
Santa Barbara, CA
The best month for swimming (with the highest average sea temperature) is August (62.2°F).
The coldest month (with the lowest average sea temperature) is April (55.7°F).
Average daylight / Average sunshine
Santa Barbara, CA
- Average daylight in January:
10h and 12min - Average daylight in February:
11h and 0min - Average daylight in March:
12h and 0min - Average daylight in April:
13h and 6min - Average daylight in May:
14h and 0min - Average daylight in June:
14h and 24min
- Average daylight in July:
14h and 12min - Average daylight in August:
13h and 24min - Average daylight in September:
12h and 24min - Average daylight in October:
11h and 18min - Average daylight in November:
10h and 24min - Average daylight in December:
9h and 54min
The month with the longest days is June (Average daylight: 14h and 24min).
The month with the shortest days is December (Average daylight: 9h and 54min).
- Average sunshine in January:
6h and 48min - Average sunshine in February:
6h and 36min - Average sunshine in March:
8h and 54min - Average sunshine in April:
11h and 6min - Average sunshine in May:
11h and 42min - Average sunshine in June:
12h and 0min
- Average sunshine in July:
12h and 0min - Average sunshine in August:
11h and 54min - Average sunshine in September:
11h and 12min - Average sunshine in October:
8h and 0min - Average sunshine in November:
7h and 12min - Average sunshine in December:
6h and 48min
The months with the most sunshine are June and July (Average sunshine: 12h and 0min).
The month with the least sunshine is February (Average sunshine: 6h and 36min).
Average sunshine days
Santa Barbara, CA
- Average sunshine days in January:
24.9 days - Average sunshine days in February:
21.6 days - Average sunshine days in March:
23.1 days - Average sunshine days in April:
25.2 days - Average sunshine days in May:
27.3 days - Average sunshine days in June:
27.2 days
- Average sunshine days in July:
25.7 days - Average sunshine days in August:
28 days - Average sunshine days in September:
26.2 days - Average sunshine days in October:
27.8 days - Average sunshine days in November:
25.8 days - Average sunshine days in December:
24.6 days
The month with the most sunshine days is August (28 days).
The month with the least sunshine days is February (21.6 days).
Average UV index
Santa Barbara, CA
The months with the highest UV index are June, July, August and September (UV index 6).
The months with the lowest UV index are January, February, March, November and December (UV index 4).
Average cloud cover
Santa Barbara, CA
The month with the most cloud cover is March (Cloud cover 23).
The month with the least cloud cover is August (Cloud cover 5).
Average visibility
Santa Barbara, CA
The months with the highest visibility are January, February, March, April, May, June, July, August, September, October, November and December (6mi).
The months with the lowest visibility are January, February, March, April, May, June, July, August, September, October, November and December (6mi).


