Climate and monthly weather forecastSouth San Francisco, CA
South San Francisco, California, USA - Climate and weather forecast by month. Detailed climate information with charts - average monthly weather with temperature, pressure, humidity, precipitation, wind, daylight, sunshine, visibility, and UV index data. The month with the most rainfall is February, when the rain falls for 6.1 days and typically aggregates up to 0.79" (20mm) of precipitation. June through August are months with the least rain when the rain falls for 1.1 days and typically aggregates up to 0.04" (1mm) of rain.
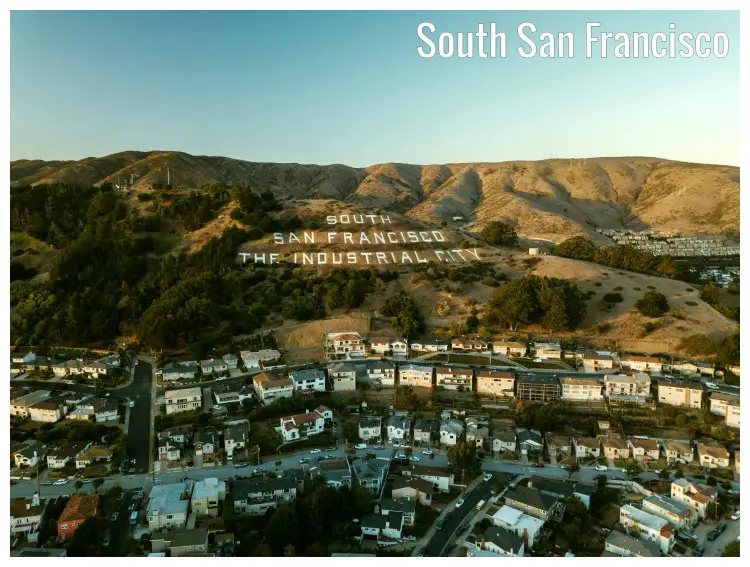
Climate and monthly weather forecast
Weather in January
January, like December, is a moderate winter month in South San Francisco, California, with an average temperature varying between 47.8°F (8.8°C) and 56.3°F (13.5°C). The weather during January records an average high-temperature of a still moderate 56.3°F (13.5°C), closely mirroring the preceding month. Weather in January »Weather in February
The last month of the winter, February, is also a moderate month in South San Francisco, California, with an average temperature ranging between max 57.2°F (14°C) and min 47.8°F (8.8°C). February's climate shows a minor adjustment in average high-temperatures to a still moderate 57.2°F (14°C) from January's 56.3°F (13.5°C). Weather in February »Weather in March
March, the first month of the spring in South San Francisco, is also a moderate month, with an average temperature varying between 48.2°F (9°C) and 58.5°F (14.7°C). The arrival of March is marked by an average high-temperature of a still mild 58.5°F (14.7°C), bearing a close resemblance to February. Weather in March »Weather in April
April in South San Francisco, California, is a comfortable spring month, with an average temperature ranging between max 61.3°F (16.3°C) and min 49.3°F (9.6°C). South San Francisco records a slight change with April's average high-temperatures adjusting to a still refreshing 61.3°F (16.3°C) from March's 58.5°F (14.7°C). Weather in April »Weather in May
May, the last month of the spring in South San Francisco, is another refreshing month, with an average temperature ranging between min 51.1°F (10.6°C) and max 63°F (17.2°C). The arrival of May coincides with an average high-temperature of a still refreshing 63°F (17.2°C), indicating a minimal shift from April's 61.3°F (16.3°C). Weather in May »Weather in June
The first month of the summer, June, is still a refreshing month in South San Francisco, California, with temperature in the range of an average high of 66.9°F (19.4°C) and an average low of 53.6°F (12°C). During June, the average high-temperature is a still refreshing 66.9°F (19.4°C), maintaining a close resemblance to that of the preceding month. Weather in June »Weather in July
July is a pleasant summer month in South San Francisco, California, with an average temperature varying between 68.9°F (20.5°C) and 54.7°F (12.6°C). The high-temperature average in July for South San Francisco is a pleasant 68.9°F (20.5°C), staying closely aligned with June's conditions. Weather in July »Weather in August
August, the last month of the summer in South San Francisco, is also an agreeable month, with an average temperature ranging between min 56.5°F (13.6°C) and max 69.1°F (20.6°C). South San Francisco sees the arrival of August with an average high-temperature of a still pleasant 69.1°F (20.6°C), indicating a subtle variation from July. Weather in August »Weather in September
The first month of the autumn, September, is also an agreeable month in South San Francisco, California, with an average temperature ranging between max 70°F (21.1°C) and min 56.5°F (13.6°C). South San Francisco experiences its highest temperatures in September, with an average peak of 70°F (21.1°C) and a low of 56.5°F (13.6°C). Weather in September »Weather in October
October, the same as September, is another enjoyable autumn month in South San Francisco, California, with an average temperature varying between 55.4°F (13°C) and 66.9°F (19.4°C). South San Francisco's weather in October, with an average high-temperature of an enjoyable 66.9°F (19.4°C), subtly shifts from September's 70°F (21.1°C). Weather in October »Weather in November
The last month of the autumn, November, is also an enjoyable month in South San Francisco, California, with an average temperature varying between 61°F (16.1°C) and 51.6°F (10.9°C). A subtle shift in South San Francisco's weather is observed as October turns into November, with the average high temperature reducing from a comfortable 66.9°F (19.4°C) to a still refreshing 61°F (16.1°C). Weather in November »Weather in December
December, the first month of the winter in South San Francisco, is still a mild month, with an average temperature fluctuating between 55.6°F (13.1°C) and 47.8°F (8.8°C). December is the month when South San Francisco experiences its coldest temperatures, averaging a high of 55.6°F (13.1°C) and a low of 47.8°F (8.8°C). Weather in December »Published by: Weather U.S. | About Us
Data Sources | Weather Forecasting & Climate
Frequently asked questions
Average temperature
South San Francisco, CA
The warmest month (with the highest average high temperature) is September (70°F).
The month with the lowest average high temperature is December (55.6°F).
The months with the highest average low temperature are August and September (56.5°F).
The coldest months (with the lowest average low temperature) are January, February and December (47.8°F).
Average pressure
South San Francisco, CA
- Average pressure in January:
30.13"Hg - Average pressure in February:
30.08"Hg - Average pressure in March:
30.07"Hg - Average pressure in April:
30.04"Hg - Average pressure in May:
29.98"Hg - Average pressure in June:
29.93"Hg
- Average pressure in July:
29.93"Hg - Average pressure in August:
29.93"Hg - Average pressure in September:
29.92"Hg - Average pressure in October:
29.98"Hg - Average pressure in November:
30.07"Hg - Average pressure in December:
30.11"Hg
The month with the highest atmospheric pressure is January (30.13"Hg).
The month with the lowest atmospheric pressure is September (29.92"Hg).
Average wind speed
South San Francisco, CA
- Average wind speed in January:
6.6mph - Average wind speed in February:
7.8mph - Average wind speed in March:
8.1mph - Average wind speed in April:
8.5mph - Average wind speed in May:
8.3mph - Average wind speed in June:
7.7mph
- Average wind speed in July:
6.5mph - Average wind speed in August:
6.3mph - Average wind speed in September:
6.2mph - Average wind speed in October:
6.5mph - Average wind speed in November:
6.5mph - Average wind speed in December:
7.3mph
The windiest month (with the highest average wind speed) is April (8.5mph).
The calmest month (with the lowest average wind speed) is September (6.2mph).
Average humidity
South San Francisco, CA
The month with the highest relative humidity is August (78%).
The months with the lowest relative humidity are October and November (71%).
Average rainfall
South San Francisco, CA
- Average rainfall in January:
0.51" - Average rainfall in February:
0.79" - Average rainfall in March:
0.63" - Average rainfall in April:
0.2" - Average rainfall in May:
0.24" - Average rainfall in June:
0.04"
- Average rainfall in July:
0.04" - Average rainfall in August:
0.04" - Average rainfall in September:
0.08" - Average rainfall in October:
0.12" - Average rainfall in November:
0.51" - Average rainfall in December:
0.71"
The wettest month (with the highest rainfall) is February (0.79").
The driest months (with the least rainfall) are June, July and August (0.04").
Average rainfall days
South San Francisco, CA
- Average rainfall days in January:
7.2 days - Average rainfall days in February:
6.1 days - Average rainfall days in March:
9.4 days - Average rainfall days in April:
5.3 days - Average rainfall days in May:
3.6 days - Average rainfall days in June:
1.1 days
- Average rainfall days in July:
1.9 days - Average rainfall days in August:
1.5 days - Average rainfall days in September:
1.9 days - Average rainfall days in October:
2.9 days - Average rainfall days in November:
5 days - Average rainfall days in December:
7.7 days
The month with the highest number of rainy days is March (9.4 days).
The month with the least rainy days is June (1.1 days).
Average daylight / Average sunshine
South San Francisco, CA
- Average daylight in January:
9h and 54min - Average daylight in February:
10h and 48min - Average daylight in March:
12h and 0min - Average daylight in April:
13h and 12min - Average daylight in May:
14h and 12min - Average daylight in June:
14h and 42min
- Average daylight in July:
14h and 30min - Average daylight in August:
13h and 36min - Average daylight in September:
12h and 24min - Average daylight in October:
11h and 12min - Average daylight in November:
10h and 12min - Average daylight in December:
9h and 36min
The month with the longest days is June (Average daylight: 14h and 42min).
The month with the shortest days is December (Average daylight: 9h and 36min).
- Average sunshine in January:
6h and 0min - Average sunshine in February:
6h and 12min - Average sunshine in March:
7h and 42min - Average sunshine in April:
10h and 18min - Average sunshine in May:
10h and 24min - Average sunshine in June:
11h and 30min
- Average sunshine in July:
11h and 42min - Average sunshine in August:
11h and 30min - Average sunshine in September:
10h and 48min - Average sunshine in October:
7h and 0min - Average sunshine in November:
6h and 30min - Average sunshine in December:
5h and 48min
The month with the most sunshine is July (Average sunshine: 11h and 42min).
The month with the least sunshine is December (Average sunshine: 5h and 48min).
Average sunshine days
South San Francisco, CA
- Average sunshine days in January:
22.7 days - Average sunshine days in February:
20.8 days - Average sunshine days in March:
19.4 days - Average sunshine days in April:
23.1 days - Average sunshine days in May:
23.3 days - Average sunshine days in June:
26.3 days
- Average sunshine days in July:
26.3 days - Average sunshine days in August:
25 days - Average sunshine days in September:
26.3 days - Average sunshine days in October:
25.9 days - Average sunshine days in November:
23.7 days - Average sunshine days in December:
22.2 days
The months with the most sunshine days are June, July and September (26.3 days).
The month with the least sunshine days is March (19.4 days).
Average UV index
South San Francisco, CA
The months with the highest UV index are June, July, August and September (UV index 5).
The months with the lowest UV index are February and December (UV index 3).
Average cloud cover
South San Francisco, CA
The month with the most cloud cover is March (Cloud cover 37).
The month with the least cloud cover is September (Cloud cover 16).
Average visibility
South San Francisco, CA
The months with the highest visibility are January, February, March, April, May, June, July, August, September, October, November and December (6mi).
The months with the lowest visibility are January, February, March, April, May, June, July, August, September, October, November and December (6mi).


