November weather forecastWalnut Creek, CA
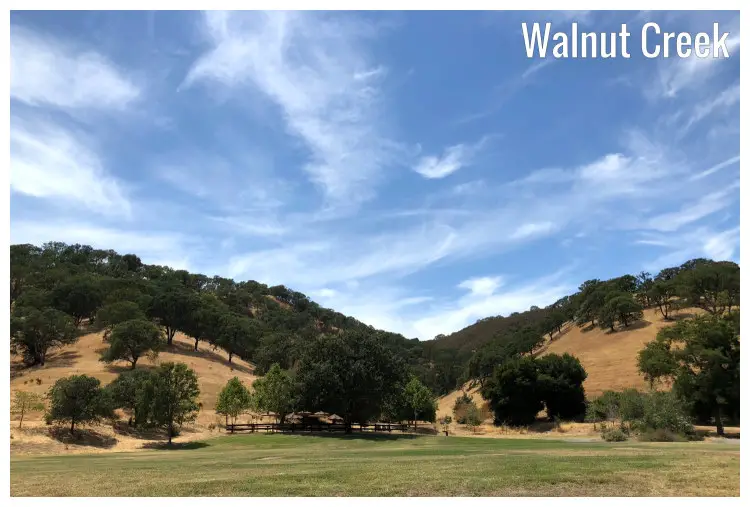
November
Weather in November
November, the last month of the autumn in Walnut Creek, is another refreshing month, with temperature in the range of an average low of 47.5°F (8.6°C) and an average high of 64°F (17.8°C).Temperature
The arrival of November corresponds with a temperature reduction, down from October's warm 74.1°F (23.4°C) to a comfortable 64°F (17.8°C). During November, Walnut Creek observes a consistent average nighttime temperature of 47.5°F (8.6°C).Humidity
The average relative humidity in November in Walnut Creek is 65%.Rainfall
In Walnut Creek, in November, during 6.8 rainfall days, 1.3" (33mm) of precipitation is typically accumulated. Throughout the year, there are 68.7 rainfall days, and 11.26" (286mm) of precipitation is accumulated.Daylight
The average length of the day in November is 10h and 8min.On the first day of the month, sunrise is at 7:34 am and sunset at 6:08 pm PDT. On the last day of November, sunrise is at 7:04 am and sunset at 4:49 pm PST.
Note: On Sunday, November 3. 2024, at 2:00 am, Daylight Saving Time ends, and the time zone changes from PDT to PST. Daylight Saving Time starts again on Sunday, March 9. 2025, at 2:00 am; consequently, the time zone reverts from PST to PDT.
Sunshine
In November, the average sunshine in Walnut Creek is 6.6h.UV index
January, February, November and December, with an average maximum UV index of 3, are months with the lowest UV index. A UV Index value of 3 to 5 symbolizes a medium vulnerability from exposure to the Sun's UV rays for the average person.Note: A maximum high UV index of 3 in November translates into the following recommendations:
Undertake precautions - Guarding against sun damage is counselled. Direct Sun exposure should be minimized especially during midday when radiation is most intense. Tightly woven clothing, when worn loosely, shields effectively against the Sun.
Published by: Weather U.S. | About Us
Data Sources | Weather Forecasting & Climate
Frequently asked questions
Average temperature in November
Walnut Creek, CA
- Average high temperature in November: 64°F
The warmest month (with the highest average high temperature) is July (82.8°F).
The month with the lowest average high temperature is December (55.4°F).
- Average low temperature in November: 47.5°F
The month with the highest average low temperature is September (57.2°F).
The coldest months (with the lowest average low temperature) are January and December (42.4°F).
Average pressure in November
Walnut Creek, CA
- Average pressure in November: 30.07"Hg
The month with the highest atmospheric pressure is January (30.14"Hg).
The month with the lowest atmospheric pressure is June (29.91"Hg).
Average wind speed in November
Walnut Creek, CA
- Average wind speed in November: 4.4mph
The windiest month (with the highest average wind speed) is May (7.3mph).
The calmest month (with the lowest average wind speed) is November (4.4mph).
Average humidity in November
Walnut Creek, CA
- Average humidity in November: 65%
The month with the highest relative humidity is March (74%).
The months with the lowest relative humidity are September and October (58%).
Average rainfall in November
Walnut Creek, CA
- Average rainfall in November: 1.3"
The wettest month (with the highest rainfall) is February (2.4").
The driest months (with the least rainfall) are July and August (0.04").
Average rainfall days in November
Walnut Creek, CA
- Average rainfall days in November: 6.8 days
The month with the highest number of rainy days is March (12.6 days).
The month with the least rainy days is August (0.8 days).
Average daylight in November /
Average sunshine in November
Walnut Creek, CA
- Average daylight in November: 10h and 6min
The month with the longest days is June (Average daylight: 14h and 48min).
The month with the shortest days is December (Average daylight: 9h and 36min).
- Average sunshine in November: 6h and 36min
The month with the most sunshine is July (Average sunshine: 12h and 0min).
The month with the least sunshine is December (Average sunshine: 5h and 48min).
Average sunshine days in November
Walnut Creek, CA
- Average sunshine days in November: 22.3 days
The month with the most sunshine days is August (29.6 days).
The month with the least sunshine days is March (17.5 days).
Average UV index in November
Walnut Creek, CA
- Average UV index in November: 3
The months with the highest UV index are June and July (UV index 6).
The months with the lowest UV index are January, February, November and December (UV index 3).
Average cloud cover in November
Walnut Creek, CA
- Average cloud cover in November: 25
The month with the most cloud cover is March (Cloud cover 36).
The month with the least cloud cover is July (Cloud cover 8).
Average visibility in November
Walnut Creek, CA
- Average visibility in November: 6mi
The months with the highest visibility are January, February, March, April, May, June, July, August, September, October, November and December (6mi).
The months with the lowest visibility are January, February, March, April, May, June, July, August, September, October, November and December (6mi).


