August weather forecastTarpon Springs, FL
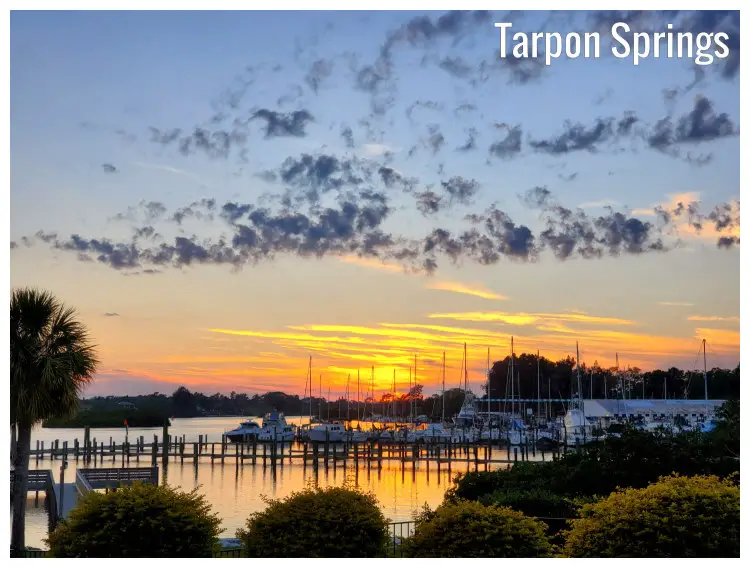
August
Weather in August
The last month of the summer, August, is another hot month in Tarpon Springs, Florida, with an average temperature fluctuating between 88.3°F (31.3°C) and 80.2°F (26.8°C).Temperature
Tarpon Springs's temperature records reveal August as the warmest month, marked by average highs of 88.3°F (31.3°C) and lows of 80.2°F (26.8°C).Heat index
August's average heat index is appraised at an extremely hot 104°F (40°C). Incorporate additional preventive steps, heat exhaustion and heat cramps are possible. Long-lasting activity may cause heatstroke.Be aware that heat index ratings are designed for shaded locations and minor breezes. Exposing to direct sunshine may enhance heat index values by 15 Fahrenheit (8 Celsius) degrees.
Note: The heat index, also known as 'real feel' or 'feels like', is a measure of how hot it feels when the actual air humidity is factored in. The effect is experienced differently by individuals, hinging on unique characteristics such as body mass, stature, and level of activity. Direct sunlight can potentially raise the heat index by 15 Fahrenheit (8 Celsius) degrees, so it's crucial to consider. Heat index values are primarily vital for children. Children commonly overlook the importance of rest and fluid replenishment. Thirst, being a delayed sign of dehydration, emphasizes the need to keep hydration up, especially during lengthy physical activities.
When it comes to cooling down, the human body's primary method is through perspiration, making use of sweat evaporation to eliminate excess heat. A higher relative humidity affects normal body cooling by reducing the evaporation rate, subsequently lowering the rate at which the body cools and increasing the perception of heat. Overheating and potential dehydration arise when body heat gain eclipses its release capability.
Humidity
The average relative humidity in August in Tarpon Springs is 74%.Rainfall
In Tarpon Springs, Florida, in August, during 17.9 rainfall days, 1.65" (42mm) of precipitation is typically accumulated. Throughout the year, there are 120.5 rainfall days, and 9.45" (240mm) of precipitation is accumulated.Ocean temperature
With an average ocean temperature of 86.5°F (30.3°C), August is the month with the warmest seawater in Tarpon Springs.Note: The charm of diving into cool waters is arguably lost when temperatures surpass 86°F (30°C).
Daylight
In Tarpon Springs, the average length of the day in August is 13h and 7min.On the first day of the month, sunrise is at 6:53 am and sunset at 8:20 pm. On the last day of August, in Tarpon Springs, sunrise is at 7:09 am and sunset at 7:52 pm EDT.
Sunshine
In August, the average sunshine in Tarpon Springs is 9.8h.UV index
The months with the highest UV index are May through September, with an average maximum UV index of 7. A UV Index value of 6 to 7 symbolizes a high health risk from exposure to the Sun's UV rays for average individuals.Note: The maximum daily UV index of 7 in August converts into the following recommendations:
Avoid excessive sunlight. Those with lighter skin may experience burning in less than 20 minutes. Stay in the shade and limit direct sun exposure between 10 a.m. and 4 p.m., when UV radiation is at its strongest. Remember, however, that not all shade structures provide full sun protection. For a sun-safe wardrobe, go for clothes that are tightly woven and generously sized. Warning! The reflection of sand and water increases the UV dose.
Published by: Weather U.S. | About Us
Data Sources | Weather Forecasting & Climate
Frequently asked questions
Average temperature in August
Tarpon Springs, FL
- Average high temperature in August: 88.3°F
The warmest month (with the highest average high temperature) is August (88.3°F).
The month with the lowest average high temperature is January (66°F).
- Average low temperature in August: 80.2°F
The month with the highest average low temperature is August (80.2°F).
The coldest month (with the lowest average low temperature) is January (54.5°F).
Average pressure in August
Tarpon Springs, FL
- Average pressure in August: 29.98"Hg
The month with the highest atmospheric pressure is January (30.14"Hg).
The month with the lowest atmospheric pressure is September (29.96"Hg).
Average wind speed in August
Tarpon Springs, FL
- Average wind speed in August: 7mph
The windiest months (with the highest average wind speed) are January, March and April (8.9mph).
The calmest month (with the lowest average wind speed) is July (6.7mph).
Average humidity in August
Tarpon Springs, FL
- Average humidity in August: 74%
The month with the highest relative humidity is December (77%).
The month with the lowest relative humidity is May (72%).
Average rainfall in August
Tarpon Springs, FL
- Average rainfall in August: 1.65"
The wettest month (with the highest rainfall) is July (1.77").
The driest month (with the least rainfall) is March (0.2").
Average rainfall days in August
Tarpon Springs, FL
- Average rainfall days in August: 17.9 days
The month with the highest number of rainy days is August (17.9 days).
The month with the least rainy days is November (5.5 days).
Average sea temperature in August
Tarpon Springs, FL
- Average sea temperature in August: 86.6°F
The best month for swimming (with the highest average sea temperature) is August (86.6°F).
The coldest month (with the lowest average sea temperature) is January (61.1°F).
Average daylight in August /
Average sunshine in August
Tarpon Springs, FL
- Average daylight in August: 13h and 6min
The month with the longest days is June (Average daylight: 13h and 54min).
The month with the shortest days is December (Average daylight: 10h and 24min).
- Average sunshine in August: 9h and 48min
The month with the most sunshine is May (Average sunshine: 11h and 18min).
The month with the least sunshine is December (Average sunshine: 6h and 30min).
Average sunshine days in August
Tarpon Springs, FL
- Average sunshine days in August: 8 days
The month with the most sunshine days is January (23.4 days).
The month with the least sunshine days is July (6.7 days).
Average UV index in August
Tarpon Springs, FL
- Average UV index in August: 7
The months with the highest UV index are May, June, July, August and September (UV index 7).
The month with the lowest UV index is January (UV index 4).
Average cloud cover in August
Tarpon Springs, FL
- Average cloud cover in August: 27
The months with the most cloud cover are January and December (Cloud cover 30).
The month with the least cloud cover is May (Cloud cover 20).
Average visibility in August
Tarpon Springs, FL
- Average visibility in August: 6mi
The months with the highest visibility are January, February, March, April, May, June, July, August, September, October, November and December (6mi).
The months with the lowest visibility are January, February, March, April, May, June, July, August, September, October, November and December (6mi).


