Climate and monthly weather forecastCopper Harbor, MI
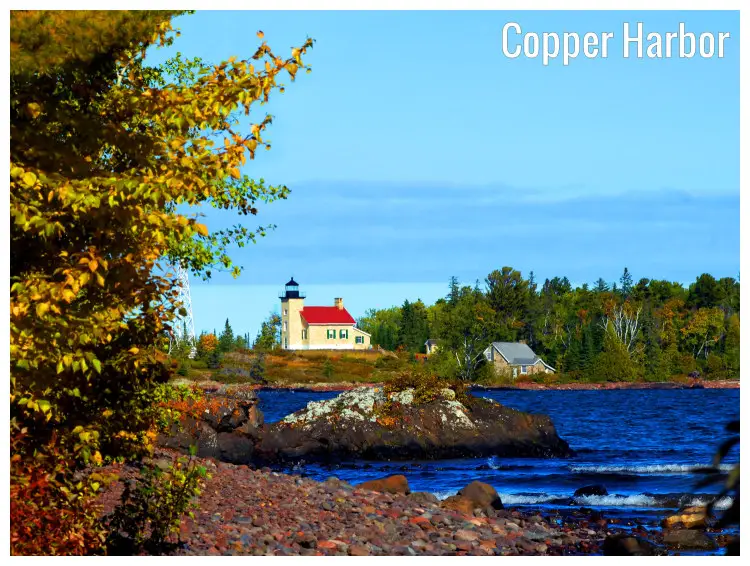
Climate and monthly weather forecast
The climate of Copper Harbor
Nestled in a port town in the U.S. state of Michigan, Copper Harbor experiences a diverse range of weather conditions throughout the year due to its geographical location and physical attributes. Its climate is classified as Dfb, as per Köppen’s climate classification, signifying a humid continental climate with no dry season and warm summers.Through the year, Copper Harbor witnesses notable shifts in temperature, precipitations, wind speed, humidity levels, and other weather parameters. From the beginning of the year, temperatures vary from a chilly 24.3°F (-4.3°C) to a relatively warm 62.6°F (17°C) during mid-year, returning to lower temperatures towards year-end. These temperature changes coincide with changes in rainfall, hovering between 1.46" (37mm) and 2.48" (63mm) per month. It is observed that the maximum rainfall of 2.48" (63mm) occurs during late summer.
Heading towards humidity, it oscillates from an 80% minimum to a high of 85%, highest in the beginning and towards the end of the year. Wind conditions in Copper Harbor display a noteworthy pattern, commencing the year with 17.8mph (28.6km/h), decreasing during mid-year and returning to high speed towards the end of the year, reaching up to a maximum gust speed of 23.6mph (38km/h).
Copper Harbor is unique due to its mid-year daylight abundance. Extended daylight hours from 15.1 hours to 15.9 hours are witnessed during the summer months. Additionally, UV index reaches its peak of 5 during the same period, indicating potential for skin damage with prolonged sun exposure during these months.
The best time to visit Copper Harbor
Considering best time to visit Copper Harbor, it usually depends on preferred activities and weather comfort. For those who enjoy milder weather, late spring to early fall, specifically from May to September, offers the most favorable conditions. Temperatures during these months range from 37°F (2.8°C) to 62.6°F (17°C), with rainfall levels moderately high, thus providing ample opportunities for outdoor activities.The worst time to visit Copper Harbor
The challenging months to visit Copper Harbor would be from November to March. These months experience the coldest temperatures falling between 24.3°F (-4.3°C) and 38.5°F (3.6°C), rendering the region quite chilly. Furthermore, snowfall is a recurrent theme during these months, coupled with reduced daylight hours, that add to the challenging weather conditions.Spring weather in Copper Harbor
Spring in Copper Harbor can be characterized by gradually warming temperatures, increasing from 30.6°F (-0.8°C) to 44.4°F (6.9°C) over March, April, and May. Rainfall remains moderate while snowfall starts to decline, from being common in early spring to rare by late spring. Wind speeds decrease during this period but gust speeds remain relatively high, averaging about 22.5mph (36.2km/h) by May.Summer weather in Copper Harbor
June, July, and August constitute the summer period in Copper Harbor. This season can be characterized by warm temperatures, extending from 50.2°F (10.1°C) to 62.6°F (17°C). Humidity peaks to 85% in June before dipping slightly to 83% by August. The amount of rainfall experienced during this time is also maximum, reaching up to 2.48" (63mm) per month.Autumn weather in Copper Harbor
Autumn in Copper Harbor extends from September to November. During these months, weather parameters transition from summer-like to winter-like conditions. Gradual cooling occurs with temperatures declining from 59.5°F (15.3°C) in September to 38.5°F (3.6°C) by November. Along with temperature drop, daylight hours also decrease during these months, falling from 12.5 hours in September to 9.3 hours in November.Winter weather in Copper Harbor
Winters in Copper Harbor are marked by cold temperatures and significant snowfall. From December to February, temperatures oscillate from 24.3°F (-4.3°C) to 29.5°F (-1.4°C). Snowfall begins in December, reaching a substantial average of 3.86" (98mm) by February. Furthermore, this period witnesses shortest daylight hours, descending to a low of 8.5 hours in December. Although the wind speed peaks during these months, gust speeds decrease compared to the rest of the year.Weather in January
Copper Harbor's weather in January is striking for its snow and cold temperatures, with a high potential for frostbite if one is not properly shielded. With a high of 24.3°F (-4.3°C), the month is among the chilliest in the year. Weather in January »Weather in February
In February, the Copper Harbor weather takes a slightly warmer turn, but it retains chilling conditions. The UV index remains at 1, suggestive of a persistent tendency towards lower temperatures. The transition from January to February does not encompass any significant leaps in weather condition. Weather in February »Weather in March
March in Copper Harbor signifies the advent of spring, bringing along a gentler, slightly more hospitable environment. Notably, in March, there's a transition towards longer sunshine days and milder temperatures, although it isn't drastically warmer. Weather in March »Weather in April
April weather in Copper Harbor marks a clear shift away from the cold clasp of winter. As the temperatures rise to a high of 37°F (2.8°C), the snow cover starts melting away, and interestingly, rainfall inches rise to 1.93" (49mm). Weather in April »Weather in May
The Copper Harbor weather in May continues to brighten, shaking off the residue of spring in preparation for summer. A recorded high of 44.4°F (6.9°C) coincides with a surge in sunshine hours to 8.7 hours, indicative of longer and warmer days. Weather in May »Weather in June
June positions Copper Harbor firmly in the grasp of summer, resulting in a consistent rise in temperature. Interestingly, the maximum wind speed dips to 10.7mph (17.2km/h), indicating calmer and less turbulent weather. Echoing the temperate weather of May, June introduces nominally higher temperatures and longer sunshine durations. Weather in June »Weather in July
July tends to be Copper Harbor's warmest month, with temperatures soaring to an impressive high of 62.6°F (17°C). A UV index of 5, the highest recorded all year, corresponds with the heat, necessitating protection from the potent sunlight. Weather in July »Weather in August
The weather in Copper Harbor in August signals the gradual retreat of summer, with a minor dip in temperature from July. While the UV index remains at 5, similar to July, subtle indicators of an arising change surface in the form of a slight increase in humidity and wind speeds. Weather in August »Weather in September
Copper Harbor's weather in September shifts with the changing of the season, as the town ushers in autumn. September's noticeable decrease in sunshine duration and temperature high down to 59.5°F (15.3°C) symbolizes the farewell to summer's reign. Weather in September »Weather in October
October in Copper Harbor is firmly within the embrace of autumn, with the temperatures and humidity dropping consistently. Notably, an increase in rainfall to 2.28" (58mm) and a decline in temperature to 48.9°F (9.4°C) foreshadow the incoming cold spell. Weather in October »Weather in November
November ushers in a tangible cold spell in Copper Harbor, with a recognizable drop in temperatures and the commencement of snowfall. With temperatures dropping to a low of 33.4°F (0.8°C), transitioning into winter from the milder autumnal climate of October necessitates warm clothing. Weather in November »Weather in December
December in Copper Harbor welcomes the depth of winter, featuring the coldest conditions with daily high temperatures averaging at a chilly 29.5°F (-1.4°C). The UV index staying at 1 suggests that the town is shrouded in winter's grip, while the increased snowfall from November corroborates it. Weather in December »Published by: Weather U.S. | About Us
Data Sources | Weather Forecasting & Climate
Frequently asked questions
Average temperature
Copper Harbor, MI
The warmest month (with the highest average high temperature) is August (62.6°F).
The month with the lowest average high temperature is January (24.3°F).
The month with the highest average low temperature is August (57.6°F).
The coldest month (with the lowest average low temperature) is February (17.2°F).
Average pressure
Copper Harbor, MI
- Average pressure in January:
30.01"Hg - Average pressure in February:
30.05"Hg - Average pressure in March:
30.09"Hg - Average pressure in April:
29.99"Hg - Average pressure in May:
29.98"Hg - Average pressure in June:
29.92"Hg
- Average pressure in July:
29.92"Hg - Average pressure in August:
29.93"Hg - Average pressure in September:
29.99"Hg - Average pressure in October:
29.94"Hg - Average pressure in November:
30"Hg - Average pressure in December:
30.02"Hg
The month with the highest atmospheric pressure is March (30.09"Hg).
The months with the lowest atmospheric pressure are June and July (29.92"Hg).
Average wind speed
Copper Harbor, MI
- Average wind speed in January:
17.8mph - Average wind speed in February:
16.9mph - Average wind speed in March:
14.2mph - Average wind speed in April:
13.7mph - Average wind speed in May:
11.6mph - Average wind speed in June:
10.1mph
- Average wind speed in July:
10mph - Average wind speed in August:
11mph - Average wind speed in September:
13mph - Average wind speed in October:
15.3mph - Average wind speed in November:
16.9mph - Average wind speed in December:
17.6mph
The windiest month (with the highest average wind speed) is January (17.8mph).
The calmest month (with the lowest average wind speed) is July (10mph).
Average humidity
Copper Harbor, MI
The months with the highest relative humidity are January and July (85%).
The months with the lowest relative humidity are October and November (78%).
Average rainfall
Copper Harbor, MI
- Average rainfall in January:
1.69" - Average rainfall in February:
1.61" - Average rainfall in March:
1.46" - Average rainfall in April:
1.93" - Average rainfall in May:
1.85" - Average rainfall in June:
2.09"
- Average rainfall in July:
2.13" - Average rainfall in August:
2.48" - Average rainfall in September:
1.89" - Average rainfall in October:
2.28" - Average rainfall in November:
1.97" - Average rainfall in December:
2.09"
The wettest month (with the highest rainfall) is August (2.48").
The driest month (with the least rainfall) is March (1.46").
Average rainfall days
Copper Harbor, MI
- Average rainfall days in January:
2.4 days - Average rainfall days in February:
1.4 days - Average rainfall days in March:
7 days - Average rainfall days in April:
9.4 days - Average rainfall days in May:
12.8 days - Average rainfall days in June:
13.1 days
- Average rainfall days in July:
13.2 days - Average rainfall days in August:
12.6 days - Average rainfall days in September:
14.6 days - Average rainfall days in October:
15.7 days - Average rainfall days in November:
8.5 days - Average rainfall days in December:
5.5 days
The month with the highest number of rainy days is October (15.7 days).
The month with the least rainy days is February (1.4 days).
Average snowfall
Copper Harbor, MI
- Average snowfall in January:
3.7" - Average snowfall in February:
3.82" - Average snowfall in March:
2.72" - Average snowfall in April:
2.36" - Average snowfall in May:
0.12" - Average snowfall in June:
0"
The month with the highest snowfall is December (3.86").
The months with the least snowfall are June, July, August and September (0").
Average snowfall days
Copper Harbor, MI
- Average snowfall days in January:
17.3 days - Average snowfall days in February:
16.3 days - Average snowfall days in March:
12.3 days - Average snowfall days in April:
6.2 days - Average snowfall days in May:
1.1 days - Average snowfall days in June:
0 days
- Average snowfall days in July:
0 days - Average snowfall days in August:
0 days - Average snowfall days in September:
0 days - Average snowfall days in October:
1.8 days - Average snowfall days in November:
9.8 days - Average snowfall days in December:
15.2 days
The month with the highest number of snowfall days is January (17.3 days).
The months with the least snowfall days are June, July, August and September (0 days).
Average daylight / Average sunshine
Copper Harbor, MI
- Average daylight in January:
9h and 0min - Average daylight in February:
10h and 18min - Average daylight in March:
11h and 54min - Average daylight in April:
13h and 42min - Average daylight in May:
15h and 6min - Average daylight in June:
15h and 54min
- Average daylight in July:
15h and 30min - Average daylight in August:
14h and 12min - Average daylight in September:
12h and 30min - Average daylight in October:
10h and 48min - Average daylight in November:
9h and 18min - Average daylight in December:
8h and 30min
The month with the longest days is June (Average daylight: 15h and 54min).
The month with the shortest days is December (Average daylight: 8h and 30min).
- Average sunshine in January:
1h and 12min - Average sunshine in February:
2h and 0min - Average sunshine in March:
4h and 18min - Average sunshine in April:
6h and 24min - Average sunshine in May:
8h and 42min - Average sunshine in June:
9h and 24min
- Average sunshine in July:
10h and 0min - Average sunshine in August:
9h and 30min - Average sunshine in September:
7h and 24min - Average sunshine in October:
4h and 54min - Average sunshine in November:
2h and 48min - Average sunshine in December:
1h and 24min
The month with the most sunshine is July (Average sunshine: 10h and 0min).
The month with the least sunshine is January (Average sunshine: 1h and 12min).
Average sunshine days
Copper Harbor, MI
- Average sunshine days in January:
3.8 days - Average sunshine days in February:
5.2 days - Average sunshine days in March:
10.8 days - Average sunshine days in April:
13.8 days - Average sunshine days in May:
15.9 days - Average sunshine days in June:
16 days
- Average sunshine days in July:
16.7 days - Average sunshine days in August:
16.7 days - Average sunshine days in September:
13.4 days - Average sunshine days in October:
11.4 days - Average sunshine days in November:
7.7 days - Average sunshine days in December:
4.1 days
The months with the most sunshine days are July and August (16.7 days).
The month with the least sunshine days is January (3.8 days).
Average UV index
Copper Harbor, MI
The months with the highest UV index are July and August (UV index 5).
The months with the lowest UV index are January, February, March, November and December (UV index 1).
Average cloud cover
Copper Harbor, MI
The month with the most cloud cover is January (Cloud cover 89).
The months with the least cloud cover are July and August (Cloud cover 32).
Average visibility
Copper Harbor, MI
The months with the highest visibility are March, April, May, June, July, August, September and October (6mi).
The months with the lowest visibility are January and December (4mi).


