Climate and monthly weather forecastLansing, MI
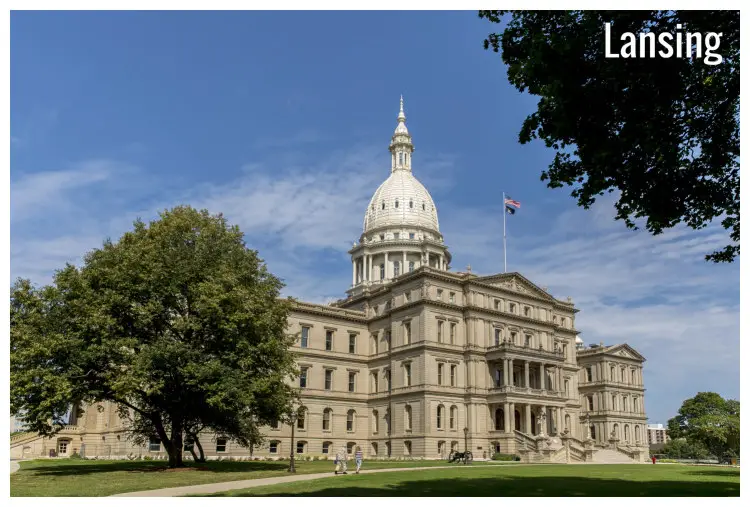
Climate and monthly weather forecast
The climate of Lansing
Lansing, the capital city of Michigan, USA, sits in the realm of the Dfb classification, according to Köppen climate methodology. Its climate subtleties are often described as humid continental, where a no dry season and warm summer are the chief characterizing elements. Throughout the year, Lansing experiences significant fluctuations in its weather parameters, presenting a diverse weather spectrum.Regarding temperatures, the trends indicate an annual journey from colder to warmer months. Lansing endures frigid winters with January displaying the lowest averages, from 17.1°F (-8.3°C) to a high of 27.1°F (-2.7°C). The city welcomes the warmest periods from June to August, where July stands out with the highest temperature averages from 60.8°F (16°C) to 79.3°F (26.3°C).
Precipitation spreads throughout the year, with May experiencing the peak average rainfall of 3.15" (80mm). The city sees drier conditions in February with the lowest rainfall value of 1.18" (30mm). Notably, Lansing sees snowfall from December to April with the deepest layers appearing in January and February, with 4.33" (110mm) and 4.17" (106mm) respectively.
The best time to visit Lansing
Considering the climatic parameters, the most favorable time for visitors to explore Lansing could arguably be between May and September. During these months, the city experiences plentiful daylight hours, with the peak being 15.3 hours in June. The sun shines generously, establishing an uplifting atmosphere. Sunshine hours are at their highest during the months of July and August with 10.3 and 9.7 hours, respectively. During this period, temperatures remain comfortably warm, ranging approximately from 48.6°F (9.2°C) to 79.3°F (26.3°C). Rainfall is also considerably lower, thereby promoting uninterrupted outdoor activities.The worst time to visit Lansing
Contrastingly, the months from November to February present the most challenging weather conditions due to the cold winter elements. This period witnesses the lowest daily averages of sunlight, with December offering only 3.4 sunshine hours and 9.1 daylight hours. The temperature also plummets during these winter months. The lowest temperatures are seen in January, dropping down to 17.1°F (-8.3°C). Visitors should also consider that the city experiences most of its annual snowfall during these months.Spring weather in Lansing
Spring in Lansing, which spans from March to May, experiences a gradual rise in temperature from lows around 27.3°F (-2.6°C) in March to highs approximately 66.6°F (19.2°C) by May. Concurrently, daylight hours increase, ushering in up to 14.6 hours by the end of spring. Rainfall is rather high, with April witnessing an average of 2.6" (66mm), while snowfall dissolves out completely by the end of April.Summer weather in Lansing
Summers in Lansing, from June to August, present a pleasing weather ambiance with warm temperatures evident from 56.8°F (13.8°C) to highs around 79.3°F (26.3°C) in July. Plenty of sunshine with an average of 10 hours per day enhances the appeal of outdoor activities. Daylight hours peak during June and July, ranging up to 15.3 hours. It should be noted that, despite the comfortable temperatures, relative humidity levels remain relatively high, lingering around 80% throughout the summer.Autumn weather in Lansing
Autumn, from September to November, sees a continuous decline in both daylight hours and temperatures. By November, daylight reduces to approximately 9.8 hours per day. Temperatures start experiencing a drop from pleasant 71.4°F (21.9°C) in September to cooler averages of 44.6°F (7°C) by November. Rainfall levels fluctuate during this period, with October witnessing as much as 2.6" (66mm) while November sees a relative decrease to 1.46" (37mm) on average.Winter weather in Lansing
Winter in Lansing, covering December through February, is synonymous with cold weather conditions. Temperatures fluctuate around 33.3°F (0.7°C) in December to lows of 17.1°F (-8.3°C) in January. The city experiences significantly less daylight hours, sinking to approximately 9.1 hours in December. Snowfall is a regular feature with 4.33" (110mm) in December and 4.17" (106mm) in January. Despite the chilly conditions, the average relative humidity still averages at around 85-88%, making for a wet cold that penetrates clothing.Weather in January
The start of the year in Lansing, Michigan, USA brings with it cold weather and persistent snowfall. January has an average high temperature of 27.1°F (-2.7°C) and a low of 17.1°F (-8.3°C). On top of this, the city experiences snowfall of 4.33" (110mm) over 16.2 days. Weather in January »Weather in February
Moving into February, the weather in Lansing sees subtle hints of warming but remains relatively cold. February is distinguishable by a slight rise in the average temperatures, up to a high of 30.6°F (-0.8°C) and a low of 18°F (-7.8°C). Weather in February »Weather in March
In March, Lansing begins to experience the move away from winter. A significant descriptor for March is the increasing temperatures, rising to a high of 41.7°F (5.4°C) and a low of 27.3°F (-2.6°C), paired with snowfall that lessens dramatically to 1.69" (43mm) over seven days. Weather in March »Weather in April
April paves the way for springtime in Lansing. Evoking a real sense of seasonal transition, the average temperatures jump to a high of 54.1°F (12.3°C) and a low of 37°F (2.8°C), while snowfall recedes to a mere 1.1" (28mm) happening rarely throughout the month. Weather in April »Weather in May
May sees a significant transformation into warmer weather in Lansing. This month is notable for temperatures warming up to an agreeable high of 66.6°F (19.2°C) and a low of 48.6°F (9.2°C). Blooms are in full force as the increased temperatures and ample sunshine hours provide perfect growing conditions. Weather in May »Weather in June
As summer arrives, June introduces more sunshine to Lansing, inviting more outdoor activities. The average temperatures peak at 74.5°F (23.6°C) for highs and 56.8°F (13.8°C) for lows, setting a comfortable climate for late-night barbecues and morning jogs. Weather in June »Weather in July
In Lansing, July marks the hottest month of the year. High temperatures reach a searing 79.3°F (26.3°C) and dip to a mellow 60.8°F (16°C), offering warm, pleasant evenings for outdoor dining or stargazing. Along with the city's summer events, the ample sunlight and raised UV index increases the appeal for water-based activities. Weather in July »Weather in August
August perpetuates the summer's warmth in Lansing but hints at the upcoming coolness. An average high of 77.7°F (25.4°C) and a low of 59.5°F (15.3°C) define the day-to-night transition in temperature. The longer daytime hours allow residents to make the most of the remaining summer. Weather in August »Weather in September
Entering the beginning of fall, September in Lansing sees a considerable dip in temperatures. A high of 71.4°F (21.9°C) and a low of 52.7°F (11.5°C) are remarkable, alongside the absence of snowfall, marking the transition into autumn. Weather in September »Weather in October
October in Lansing embraces the heart of fall, with cooler temperatures and more consistent rainfall. The average high drops to 58.1°F (14.5°C), and the low to 43.3°F (6.3°C), worthy of note for those planning outdoor activities. Weather in October »Weather in November
November in Lansing marks the transition into winter conditions. With a significant drop in the average high temperature to 44.6°F (7°C) and low to 32.5°F (0.3°C), November embodies a shift to the cold weather. The first signs of snowfall return after a warm season hiatus. Weather in November »Weather in December
Concluding the year in Lansing, December reinvigorates the full swing of winter. Characterised by an average high of 33.3°F (0.7°C) and a low of 24.8°F (-4°C), together with snowfall averaging 2.91" (74mm) over 12.6 days, it signals the return of winter coats and boots. Weather in December »Published by: Weather U.S. | About Us
Data Sources | Weather Forecasting & Climate
Frequently asked questions
Average temperature
Lansing, MI
The warmest month (with the highest average high temperature) is July (79.3°F).
The month with the lowest average high temperature is January (27.1°F).
The month with the highest average low temperature is July (60.8°F).
The coldest month (with the lowest average low temperature) is January (17.1°F).
Average pressure
Lansing, MI
- Average pressure in January:
30.07"Hg - Average pressure in February:
30.07"Hg - Average pressure in March:
30.09"Hg - Average pressure in April:
29.96"Hg - Average pressure in May:
29.98"Hg - Average pressure in June:
29.93"Hg
- Average pressure in July:
29.96"Hg - Average pressure in August:
29.97"Hg - Average pressure in September:
30.03"Hg - Average pressure in October:
29.99"Hg - Average pressure in November:
30.08"Hg - Average pressure in December:
30.07"Hg
The month with the highest atmospheric pressure is March (30.09"Hg).
The month with the lowest atmospheric pressure is June (29.93"Hg).
Average wind speed
Lansing, MI
- Average wind speed in January:
10.1mph - Average wind speed in February:
10.1mph - Average wind speed in March:
9.6mph - Average wind speed in April:
9.9mph - Average wind speed in May:
8.5mph - Average wind speed in June:
7.5mph
- Average wind speed in July:
6.6mph - Average wind speed in August:
6.6mph - Average wind speed in September:
7.3mph - Average wind speed in October:
9.2mph - Average wind speed in November:
9.8mph - Average wind speed in December:
9.7mph
The windiest months (with the highest average wind speed) are January and February (10.1mph).
The calmest months (with the lowest average wind speed) are July and August (6.6mph).
Average humidity
Lansing, MI
The month with the highest relative humidity is January (88%).
The month with the lowest relative humidity is April (77%).
Average rainfall
Lansing, MI
- Average rainfall in January:
1.81" - Average rainfall in February:
1.38" - Average rainfall in March:
1.57" - Average rainfall in April:
2.6" - Average rainfall in May:
3.15" - Average rainfall in June:
2.36"
The wettest month (with the highest rainfall) is May (3.15").
The driest month (with the least rainfall) is February (1.38").
Average rainfall days
Lansing, MI
- Average rainfall days in January:
7.3 days - Average rainfall days in February:
5.7 days - Average rainfall days in March:
11.3 days - Average rainfall days in April:
15.3 days - Average rainfall days in May:
17.2 days - Average rainfall days in June:
15 days
- Average rainfall days in July:
14.1 days - Average rainfall days in August:
13.3 days - Average rainfall days in September:
11.8 days - Average rainfall days in October:
15.3 days - Average rainfall days in November:
10 days - Average rainfall days in December:
8.3 days
The month with the highest number of rainy days is May (17.2 days).
The month with the least rainy days is February (5.7 days).
Average snowfall
Lansing, MI
- Average snowfall in January:
4.33" - Average snowfall in February:
4.17" - Average snowfall in March:
1.69" - Average snowfall in April:
1.1" - Average snowfall in May:
0.04" - Average snowfall in June:
0"
The month with the highest snowfall is January (4.33").
The months with the least snowfall are June, July, August and September (0").
Average snowfall days
Lansing, MI
- Average snowfall days in January:
16.2 days - Average snowfall days in February:
13.8 days - Average snowfall days in March:
7.1 days - Average snowfall days in April:
2.6 days - Average snowfall days in May:
0.3 days - Average snowfall days in June:
0 days
- Average snowfall days in July:
0 days - Average snowfall days in August:
0 days - Average snowfall days in September:
0 days - Average snowfall days in October:
0.4 days - Average snowfall days in November:
6.2 days - Average snowfall days in December:
12.6 days
The month with the highest number of snowfall days is January (16.2 days).
The months with the least snowfall days are June, July, August and September (0 days).
Average daylight / Average sunshine
Lansing, MI
- Average daylight in January:
9h and 30min - Average daylight in February:
10h and 36min - Average daylight in March:
12h and 0min - Average daylight in April:
13h and 24min - Average daylight in May:
14h and 42min - Average daylight in June:
15h and 18min
- Average daylight in July:
15h and 0min - Average daylight in August:
13h and 54min - Average daylight in September:
12h and 30min - Average daylight in October:
11h and 0min - Average daylight in November:
9h and 48min - Average daylight in December:
9h and 6min
The month with the longest days is June (Average daylight: 15h and 18min).
The month with the shortest days is December (Average daylight: 9h and 6min).
- Average sunshine in January:
2h and 42min - Average sunshine in February:
3h and 48min - Average sunshine in March:
5h and 36min - Average sunshine in April:
6h and 54min - Average sunshine in May:
8h and 24min - Average sunshine in June:
9h and 48min
- Average sunshine in July:
10h and 18min - Average sunshine in August:
9h and 42min - Average sunshine in September:
8h and 0min - Average sunshine in October:
5h and 24min - Average sunshine in November:
4h and 24min - Average sunshine in December:
3h and 24min
The month with the most sunshine is July (Average sunshine: 10h and 18min).
The month with the least sunshine is January (Average sunshine: 2h and 42min).
Average sunshine days
Lansing, MI
- Average sunshine days in January:
10.3 days - Average sunshine days in February:
10.9 days - Average sunshine days in March:
14.3 days - Average sunshine days in April:
11.8 days - Average sunshine days in May:
10.9 days - Average sunshine days in June:
12.8 days
- Average sunshine days in July:
13.6 days - Average sunshine days in August:
14.3 days - Average sunshine days in September:
15.5 days - Average sunshine days in October:
12.6 days - Average sunshine days in November:
14.6 days - Average sunshine days in December:
12.5 days
The month with the most sunshine days is September (15.5 days).
The month with the least sunshine days is January (10.3 days).
Average UV index
Lansing, MI
The months with the highest UV index are May, June, July and August (UV index 5).
The months with the lowest UV index are January and December (UV index 1).
Average cloud cover
Lansing, MI
The month with the most cloud cover is January (Cloud cover 71).
The month with the least cloud cover is July (Cloud cover 30).
Average visibility
Lansing, MI
The months with the highest visibility are March, April, May, June, July, August, October and November (6mi).
The months with the lowest visibility are January, February, September and December (5mi).


