October weather forecastTraverse City, MI
October
Weather in October
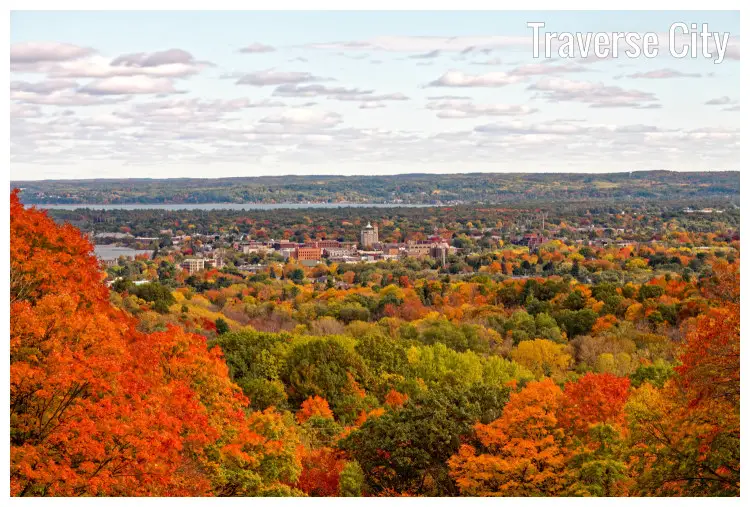
October in Traverse City records a substantial drop in temperatures, from 54.7°F (12.6°C) to a chilly 44.8°F (7.1°C). Autumn leaves in full splendor add to the city's charm, despite an increase in rainfall up to 0.91" (23mm). Daylight decreases to approximately 11 hours, signaling shorter days. November promises to bring even colder weather as winter starts setting in.Temperature
As October begins, there is a decrease in the average high-temperature, falling from an enjoyable 67.5°F (19.7°C) in September to a fresh 54.7°F (12.6°C). An average nighttime temperature of 44.8°F (7.1°C) is observed in Traverse City, Michigan, during October.Humidity
In October, the average relative humidity is 78%.Rainfall
In October, in Traverse City, the rain falls for 11.2 days. Throughout October, 0.91" (23mm) of precipitation is accumulated. Throughout the year, in Traverse City, Michigan, there are 94.8 rainfall days, and 8.35" (212mm) of precipitation is accumulated.Snowfall
Months with snowfall in Traverse City are January through May, October through December. October is the first month it typically snows. Throughout October, in the average 1.2 snowfall days, it receives 0.28" (7mm) of snow. Throughout the year, in Traverse City, there are 62.8 snowfall days, and 10.67" (271mm) of snow is accumulated.Ocean temperature
In Traverse City, in October, the average water temperature is 55.6°F (13.1°C).Note: Engaging in a swim in 55.6°F (13.1°C) can threaten life. Brief exposure to 55.4°F (13°C) waters is uneasy, and submersion below 50°F (10°C) can lead to cold shock and disrupted breathing patterns, varying by individual.
Daylight
In October, the average length of the day in Traverse City is 10h and 58min.On the first day of October, sunrise is at 7:41 am and sunset at 7:22 pm. On the last day of the month, sunrise is at 8:20 am and sunset at 6:32 pm EDT.
Sunshine
In October, the average sunshine in Traverse City is 5h.UV index
In October, the average daily maximum UV index is 2. A UV Index value of 2, and less, symbolizes a low threat to health from exposure to the Sun's UV radiation for ordinary individuals.Note: The daily high UV index of 2 during October translates into the following recommendations:
Protection from prolonged sun exposure is necessary for babies, children, and individuals with sensitive skin. Considering the harmful UV rays from the Sun during midday, it's essential to reduce exposure. A hat with a broad brim is indispensable, filtering out up to half of UV rays. Take warning! The intensity of the Sun's UV radiation can be nearly amplified twice due to snow reflection.
Published by: Weather U.S. | About Us
Data Sources | Weather Forecasting & Climate
Frequently asked questions
Average temperature in October
Traverse City, MI
- Average high temperature in October: 54.7°F
The warmest month (with the highest average high temperature) is August (73.6°F).
The month with the lowest average high temperature is January (25.7°F).
- Average low temperature in October: 44.8°F
The month with the highest average low temperature is August (59.5°F).
The coldest months (with the lowest average low temperature) are January and February (18.1°F).
Average pressure in October
Traverse City, MI
- Average pressure in October: 29.97"Hg
The month with the highest atmospheric pressure is March (30.09"Hg).
The month with the lowest atmospheric pressure is June (29.92"Hg).
Average wind speed in October
Traverse City, MI
- Average wind speed in October: 10.7mph
The windiest months (with the highest average wind speed) are January and December (12mph).
The calmest month (with the lowest average wind speed) is July (7.4mph).
Average humidity in October
Traverse City, MI
- Average humidity in October: 78%
The month with the highest relative humidity is January (87%).
The months with the lowest relative humidity are April and May (77%).
Average rainfall in October
Traverse City, MI
- Average rainfall in October: 0.91"
The wettest month (with the highest rainfall) is May (0.98").
The driest month (with the least rainfall) is February (0.47").
Average rainfall days in October
Traverse City, MI
- Average rainfall days in October: 11.2 days
The month with the highest number of rainy days is May (11.5 days).
The month with the least rainy days is February (2.1 days).
Average snowfall in October
Traverse City, MI
- Average snowfall in October: 0.28"
The months with the highest snowfall are January and November (2.2").
The months with the least snowfall are June, July, August and September (0").
Average snowfall days in October
Traverse City, MI
- Average snowfall days in October: 1.2 days
The month with the highest number of snowfall days is January (15.6 days).
The months with the least snowfall days are June, July, August and September (0 days).
Average sea temperature in October
Traverse City, MI
- Average sea temperature in October: 55.7°F
The best month for swimming (with the highest average sea temperature) is August (69.7°F).
The coldest month (with the lowest average sea temperature) is March (35.4°F).
Average daylight in October /
Average sunshine in October
Traverse City, MI
- Average daylight in October: 11h and 0min
The month with the longest days is June (Average daylight: 15h and 30min).
The month with the shortest days is December (Average daylight: 8h and 54min).
- Average sunshine in October: 5h and 0min
The month with the most sunshine is July (Average sunshine: 10h and 18min).
The month with the least sunshine is January (Average sunshine: 1h and 48min).
Average sunshine days in October
Traverse City, MI
- Average sunshine days in October: 16.4 days
The month with the most sunshine days is March (18.8 days).
The month with the least sunshine days is February (14.6 days).
Average UV index in October
Traverse City, MI
- Average UV index in October: 2
The months with the highest UV index are June, July and August (UV index 5).
The months with the lowest UV index are January, February, March, November and December (UV index 1).
Average cloud cover in October
Traverse City, MI
- Average cloud cover in October: 54
The month with the most cloud cover is January (Cloud cover 82).
The month with the least cloud cover is July (Cloud cover 29).
Average visibility in October
Traverse City, MI
- Average visibility in October: 6mi
The months with the highest visibility are January, February, March, April, May, June, July, August, September, October, November and December (6mi).
The months with the lowest visibility are January, February, March, April, May, June, July, August, September, October, November and December (6mi).


