Climate and monthly weather forecastGulfport, MS
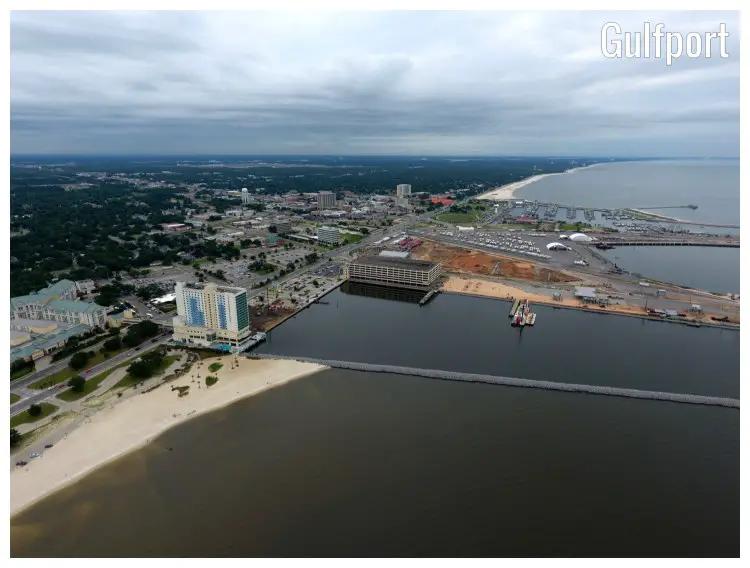
Climate and monthly weather forecast
The climate of Gulfport
Gulfport, Mississippi, situated on the Gulf of Mexico's coastlines, exhibits the predominating climate of Köppen's Humid Subtropical type, labeled as Cfa. There is a distinguishing characteristic: a year-round wet season with high humidity coupled with substantial rainfall in all months.The city experiences average high temperatures from 59.2°F (15.1°C) in January to 89.8°F (32.1°C) in July and August. On the cooler end, temperatures drop to an average low between 46°F (7.8°C) in January and 77.7°F (25.4°C) from July to August. Humidity relatively remains stable throughout the year, staying around 74%, with December seeing the least humidity at 74% and February noticing the highest at 79%.
Annual rainfall in the city registers significant numbers, peaking in August at 6.89" (175mm). It is worth noting that the number of rainfall days is most noticeable from June to August, with as many as 24 days per month. The amount of snowfall is negligible, with rare appearances only in January and December.
The best time to visit Gulfport
For visitors seeking the finest weather, the period between April and June proves to be the most agreeable time for a Gulfport trip. During these months, the city experiences warmer temperatures ranging from 69.4°F (20.8°C) in April to 88.3°F (31.3°C) in June with relative humidity hovering round 74%. This period also observes daylight hours extending from 12 hours to 14.1 hours per day, allowing abundant light for outdoor activities. This is the beginning of the warmer part of the year, with the least amount of rain and fewer rainy days, creating an enjoyable and comfortable environment.The worst time to visit Gulfport
On the contrast, Gulfport encounters its most challenging weather conditions between July and September. During this time, temperatures soar to high 80s°F, with July and August reaching up to 89.8°F (32.1°C) and 89.6°F (32°C) respectively. Along with soaring temperatures, these months also record the highest amount of rainfall, with an average precipitation of 6.14" (156mm) in July, reaching up to 6.89" (175mm) in August. The latter month also has the highest number of rainfall days, approximately 24.Spring weather in Gulfport
Spring in Gulfport extends from March through to May. Throughout these months, the city experiences an array of weather changes. Temperatures during this time gradually rise from an average high of 69.4°F (20.8°C) in March to 82.8°F (28.2°C) in May. The corresponding average lows also increase from 56.3°F (13.5°C) to 69.4°F (20.8°C) in the same duration. The city also witnesses an upturn in the hours of daylight, from 12 hours in March to 13.7 hours in May.Summer weather in Gulfport
Summer in Gulfport, from June to August, is typically hot with the maximum temperature averaging from 88.3°F (31.3°C) in June to 89.6°F (32°C) in August. The city also experiences its maximum amount of rainfall during this season, with the highest numbers in August at almost 7" (178mm). The average number of rainfall days also peaks during this time, at 24.2 days in July and up to 24.3 days in August.Autumn weather in Gulfport
Autumn in Gulfport lasts from September to November. During this period, the city experiences a gradual decline in temperature from a high of 86.5°F (30.3°C) in September to a cooler 68.2°F (20.1°C) in November. Corresponding to the drop in temperature, the number of rainfall days also reduces to 11.3 days in November marking the arrival of drier months.Winter weather in Gulfport
Winter in Gulfport, falling between December and February, witnesses relatively mild temperatures compared to other parts of the country. The average high temperature during this time ranges between 59.2°F (15.1°C) in December and 63.3°F (17.4°C) in February. The corresponding average low temperatures oscillate between 46°F (7.8°C) in December and 50.5°F (10.3°C) in February. The amount of rainfall during this period remains moderate, with an average of 3.7" (94mm) in December and 2.6" (66mm) in February.Weather in January
As Gulfport transitions into the New Year, a mild winter climate persists. The city experiences its coldest temperatures and lowest UV index at 4. Still, compared to February, January maintains a cooler ambiance. Residents encounter periods of overcast skies, with 37% cloud cover being the norm. Weather in January »Weather in February
February in Gulfport exhibits rising temperatures leading towards the advent of spring, though the weather remains crisp. Sea temperatures start increasing from January's 56.8°F (13.8°C), hinting at the upcoming warmer months. Weather in February »Weather in March
As spring arrives in Gulfport, the city witnesses perceptible changes. Weather conditions shift towards warmth, with temperatures exceeding that of February. Despite the increase in rainfall, noticeable from 2.6" (66mm) to 2.68" (68mm), the city begins to awaken with blooming flora. Weather in March »Weather in April
Gulfport, in April, presents an inviting climate, paving the way for frequent outings. With warmer weather than March, the city welcomes beach-goers and sunbathers. Even though it sees slight rainfall, the city’s beauty unveils under clear skies and brilliant sunshine. Weather in April »Weather in May
May matures into full-blown spring in Gulfport, with temperatures following an upward trend. The city observes an increase in daylight hours, shifting from April's 12.9 hours to May's 13.7 hours. Though it experiences a slight uptick in rainfall at 2.95" (75mm), the city's vibrant greenery comes alive under the sunlight. Weather in May »Weather in June
June in Gulfport heralds the onset of summer, with the weather becoming noticeably hotter than in May. On the bright side, the city experiences its longest daylight hours at 14.1, setting the scene for adventurous summer activities. Weather in June »Weather in July
Gulfport's weather peaks in July, experiencing its highest temperatures and rainfall. With a notable frequency of precipitation events spanning 24.2 days and 6.14" (156mm), the city remains warm and humid. Despite the high humidity, it still maintains a distinct charm, offering refuge under shade trees and cool interior spaces. Weather in July »Weather in August
August in Gulfport persists with the summer fervor. The weather remains similar to July, with high temperatures and increased humidity. However, a marginal decrease in rainfall from 6.14" (156mm) to 6.89" (175mm) makes the tropical environment tangible. Weather in August »Weather in September
September brings a sense of calm to Gulfport's weather, marking the end of the hot, humid summer. The month experiences lowering temperatures when compared to August, giving way to a more pleasant climate. Despite the lingering humidity and a decrease in rainfall that goes down to 4.06" (103mm), the city starts to display autumn's early signs. Weather in September »Weather in October
October in Gulfport introduces a gentle transition into the autumn season. The weather significantly cools compared to September, thus paving the way for comfortable outdoor activities. However, the city continues to see less rainfall, which moves down to 3.07" (78mm). Weather in October »Weather in November
November showcases early winter characteristics in Gulfport, with the weather becoming chillier than in October. As the city moves towards the year's end, beach activities gradually decline due to dropping sea temperatures. However, the cooler climate dramatically transforms the city into a winter wonderland. Weather in November »Weather in December
Gulfport embraces winter in December, presenting the coolest weather compared to previous months. The sea temperature drops from November's 68.3°F (20.2°C), indicating winter's firm establishment. The festivities fill the air as the city readies for Christmas celebrations. Weather in December »Published by: Weather U.S. | About Us
Data Sources | Weather Forecasting & Climate
Frequently asked questions
Average temperature
Gulfport, MS
The warmest month (with the highest average high temperature) is July (89.8°F).
The month with the lowest average high temperature is January (59.2°F).
The month with the highest average low temperature is August (77.7°F).
The coldest month (with the lowest average low temperature) is January (46°F).
Average pressure
Gulfport, MS
- Average pressure in January:
30.16"Hg - Average pressure in February:
30.11"Hg - Average pressure in March:
30.09"Hg - Average pressure in April:
30.01"Hg - Average pressure in May:
30"Hg - Average pressure in June:
29.97"Hg
- Average pressure in July:
30"Hg - Average pressure in August:
29.97"Hg - Average pressure in September:
29.98"Hg - Average pressure in October:
30.02"Hg - Average pressure in November:
30.13"Hg - Average pressure in December:
30.13"Hg
The month with the highest atmospheric pressure is January (30.16"Hg).
The months with the lowest atmospheric pressure are June and August (29.97"Hg).
Average wind speed
Gulfport, MS
- Average wind speed in January:
8.5mph - Average wind speed in February:
8.5mph - Average wind speed in March:
8.5mph - Average wind speed in April:
8.7mph - Average wind speed in May:
7.4mph - Average wind speed in June:
6.6mph
- Average wind speed in July:
6mph - Average wind speed in August:
6mph - Average wind speed in September:
6.3mph - Average wind speed in October:
7.6mph - Average wind speed in November:
8.1mph - Average wind speed in December:
8.4mph
The windiest month (with the highest average wind speed) is April (8.7mph).
The calmest months (with the lowest average wind speed) are July and August (6mph).
Average humidity
Gulfport, MS
The month with the highest relative humidity is December (79%).
The month with the lowest relative humidity is October (70%).
Average rainfall
Gulfport, MS
- Average rainfall in January:
2.52" - Average rainfall in February:
2.6" - Average rainfall in March:
2.68" - Average rainfall in April:
2.44" - Average rainfall in May:
2.95" - Average rainfall in June:
4.49"
- Average rainfall in July:
6.14" - Average rainfall in August:
6.89" - Average rainfall in September:
4.06" - Average rainfall in October:
3.07" - Average rainfall in November:
2.09" - Average rainfall in December:
3.7"
The wettest month (with the highest rainfall) is August (6.89").
The driest month (with the least rainfall) is November (2.09").
Average rainfall days
Gulfport, MS
- Average rainfall days in January:
11.4 days - Average rainfall days in February:
13.3 days - Average rainfall days in March:
13.7 days - Average rainfall days in April:
11 days - Average rainfall days in May:
14.2 days - Average rainfall days in June:
19.1 days
- Average rainfall days in July:
24.2 days - Average rainfall days in August:
24.3 days - Average rainfall days in September:
19.6 days - Average rainfall days in October:
11.3 days - Average rainfall days in November:
8.6 days - Average rainfall days in December:
13.8 days
The month with the highest number of rainy days is August (24.3 days).
The month with the least rainy days is November (8.6 days).
Average snowfall
Gulfport, MS
The month with the highest snowfall is January (0.31").
The months with the least snowfall are February, March, April, May, June, July, August, September, October, November and December (0").
Average snowfall days
Gulfport, MS
- Average snowfall days in January:
0.3 days - Average snowfall days in February:
0 days - Average snowfall days in March:
0 days - Average snowfall days in April:
0 days - Average snowfall days in May:
0 days - Average snowfall days in June:
0 days
- Average snowfall days in July:
0 days - Average snowfall days in August:
0 days - Average snowfall days in September:
0 days - Average snowfall days in October:
0 days - Average snowfall days in November:
0 days - Average snowfall days in December:
0.1 days
The month with the highest number of snowfall days is January (0.3 days).
The months with the least snowfall days are February, March, April, May, June, July, August, September, October and November (0 days).
Average sea temperature
Gulfport, MS
The best month for swimming (with the highest average sea temperature) is August (86.5°F).
The coldest month (with the lowest average sea temperature) is January (56.8°F).
Average daylight / Average sunshine
Gulfport, MS
- Average daylight in January:
10h and 24min - Average daylight in February:
11h and 6min - Average daylight in March:
12h and 0min - Average daylight in April:
12h and 54min - Average daylight in May:
13h and 42min - Average daylight in June:
14h and 6min
- Average daylight in July:
13h and 54min - Average daylight in August:
13h and 12min - Average daylight in September:
12h and 18min - Average daylight in October:
11h and 24min - Average daylight in November:
10h and 36min - Average daylight in December:
10h and 12min
The month with the longest days is June (Average daylight: 14h and 6min).
The month with the shortest days is December (Average daylight: 10h and 12min).
- Average sunshine in January:
5h and 42min - Average sunshine in February:
5h and 24min - Average sunshine in March:
7h and 48min - Average sunshine in April:
10h and 6min - Average sunshine in May:
10h and 36min - Average sunshine in June:
11h and 6min
- Average sunshine in July:
10h and 36min - Average sunshine in August:
10h and 48min - Average sunshine in September:
10h and 0min - Average sunshine in October:
7h and 48min - Average sunshine in November:
6h and 12min - Average sunshine in December:
5h and 12min
The month with the most sunshine is June (Average sunshine: 11h and 6min).
The month with the least sunshine is December (Average sunshine: 5h and 12min).
Average sunshine days
Gulfport, MS
- Average sunshine days in January:
18.1 days - Average sunshine days in February:
13.3 days - Average sunshine days in March:
15.7 days - Average sunshine days in April:
16.6 days - Average sunshine days in May:
14.4 days - Average sunshine days in June:
8.7 days
- Average sunshine days in July:
4.4 days - Average sunshine days in August:
4.7 days - Average sunshine days in September:
8.5 days - Average sunshine days in October:
17.4 days - Average sunshine days in November:
18.9 days - Average sunshine days in December:
15.4 days
The month with the most sunshine days is November (18.9 days).
The month with the least sunshine days is July (4.4 days).
Average UV index
Gulfport, MS
The months with the highest UV index are May, June, July and August (UV index 7).
The months with the lowest UV index are January and December (UV index 4).
Average cloud cover
Gulfport, MS
The month with the most cloud cover is December (Cloud cover 44).
The month with the least cloud cover is October (Cloud cover 23).
Average visibility
Gulfport, MS
The months with the highest visibility are January, February, March, April, May, June, July, August, September, October, November and December (6mi).
The months with the lowest visibility are January, February, March, April, May, June, July, August, September, October, November and December (6mi).


