Climate and monthly weather forecastHillsboro, OR
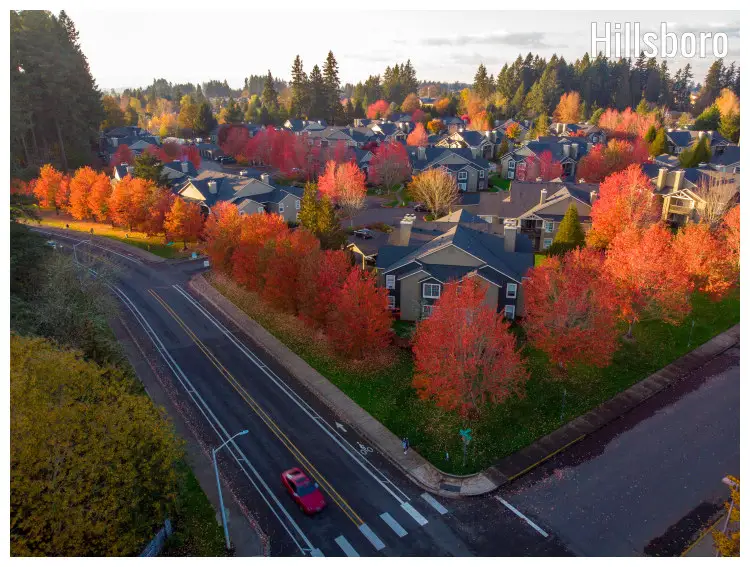
Climate and monthly weather forecast
The climate of Hillsboro
Marking its presence in the state of Oregon, USA, Hillsboro has been designated with the Csb, Mediterranean warm climate according to the Köppen climate classification. This city experiences warm summers and temperatures that remain moderate throughout the year. The annual humidity remains stable at around 70%, contributing to a climate that varies but manages to avoid extremes.A discernible fluctuation can be observed in the temperature readings, from an absolute minimum of 34°F (1.1°C) in the month of January to a zenith of 81.5°F (27.5°C) in August. It should be noted that the mercury remains relatively consistent between May and September, with minor variations. In addition to this, the rainfall pattern reflects a certain consistency, with most precipitation taking place in the winter months, especially from November to January, with an apex of 4.57" (116mm) in January. The summer months of July and August bear the brunt of the dry weather with an average rainfall of 0.39" (10mm) and 0.31" (8mm), respectively.
As far as the sunshine index is concerned, the months from May to August clock in the most sunlight hours, with July leading the roster with 15.3 hours. Decreasing daylight hours can be observed from September, reaching the lowest point in December with 8.8 hours. In tune with the Mediterranean climate type, Hillsboro also experiences a spike in UV index during the summer months, peaking at a value of 6 in July.
The best time to visit Hillsboro
Considering the temperature and rainfall, the summer months from June through August would be an idyllic time to plan a visit to Hillsboro. The mercury remains in the comfortable 70s°F and the rainfall is at its lowest during the year. These months offer maximum daylight hours and a significant amount of sunlight. The UV index also reaches its peak during these months, sitting at a value of 5 in June and stretching up to 6 in July, so sun protection measures would be advisable.The worst time to visit Hillsboro
On the flip side, the winter months from November to January are characterized by relatively low temperatures, sometimes dipping down to 34°F (1.1°C) in January. In addition, these months witness the highest rainfall, often reaching over 4" (102mm) in January. Also, these months administer less sunshine with shorter daylight hours and a low UV index that hovers from 2 to 3. As such, these months might not be the most suitable for outdoor activities or travel.Spring weather in Hillsboro
Settings change as Hillsboro steps into spring during the months from March to May. Temperature rises gradually from 52.2°F (11.2°C) in March to 67.1°F (19.5°C) in May. The city receives a moderate amount of rainfall in spring, marking slight increases each month from 3.35" (85mm) in March to 1.73" (44mm) in May. Days grow longer as well, with daylight hours stretching from 12 hours in March to nearly 15 hours in May.Summer weather in Hillsboro
Summer in Hillsboro, spanning from June to August, presents warm temperatures, hovering from 72.7°F (22.6°C) in June to a peak of 81.5°F (27.5°C) in August. It is the driest season of the year with rainfall measures at their lowest; 1.1" (28mm) in June rounding off to a mere 0.31" (8mm) in August. The longest days of the year occur in this season, with sunlight spanning 15.6 hours in June and decreasing slightly to 14.1 hours by August.Autumn weather in Hillsboro
Entering the autumn months between September and November, Hillsboro experiences a gradual drop in temperatures with a significant increase in rainfall. The temperature decreases from 73.9°F (23.3°C) in September to 50.7°F (10.4°C) in November. Rainfall ascends from 1.46" (37mm) in September to a heftier 3.19" (81mm) in November, indicating a shift in climate. However, the daylight hours decrease from 12.5 hours in September to 9.5 hours in November.Winter weather in Hillsboro
The winter months of December to February are characterized by the lowest temperatures and the highest rainfall of the year. Temperatures plummet to a minimum of 34°F (1.1°C) in January and the rainfall maxes at 4.57" (116mm) in December. Daylight is at a premium during these months, with an average of only 9.2 hours in December shrinking to 8.8 hours in February. Consequently, the UV index drops to a minimum value of 2 during these months, showing a stark decrease in intensity from the summer months.Weather in January
January temperatures in Hillsboro, Oregon set the tone for the year with cold highs averaging around 45.3°F (7.4°C) and the lowest typically registering at 34.7°F (1.5°C). The city has a predominantly cloud-filled sky, with humidity at its peak, leading to frequent rainfall. Weather in January »Weather in February
In February, Hillsboro's weather continues the pattern set in January, albeit with a slight increase in temperatures to nearly 47.3°F (8.5°C). Although the crispness in the air and the reduced cloudiness give an impression of spring's arrival, rain remains a constant companion in this month. Weather in February »Weather in March
March officially marks the onset of spring in Hillsboro, accompanied by mild temperatures, with an average high of nearly 52.2°F (11.2°C). Relatively longer, brighter days can be expected with a dip in cloud coverage, while glimpses of blue skies are abundant. Weather in March »Weather in April
In April, Hillsboro heralds a significant transition from the clammy weather to the delightful freshness of spring with temperatures rising up to 58.3°F (14.6°C). The rising warmth, along with visibly reduced rain and snow, predicts the onset of summer. Weather in April »Weather in May
May in Hillsboro sees a marked decrease in cloud cover and allows residents to enjoy the sun for an average of 8.3 hours a day. The warmth signifies the transition from spring to summer, driving greenery to flourish, contrasting beautifully with the clear blue skies. Weather in May »Weather in June
June greets Hillsboro with the arrival of summer, with temperatures that can soar up to 72.7°F (22.6°C). This relatively drier month features clearer skies and longer daylight hours, casting a warm, inviting hue over the city. Notably, the rainfall dramatically drops from May's figures, with precipitation even more infrequent. Weather in June »Weather in July
As the warmest month in Hillsboro, July showcases peak summer with an average high temperature reaching as much as 80.6°F (27°C), reflective of the city's moderate summer weather. Humidity is relatively low, and the frequency of rainfall reaches its annual low. Weather in July »Weather in August
August extends Hillsboro’s warm temperatures, from July, with high averages around 81.5°F (27.5°C). However, the dryness in the atmosphere begins to give way to increasing humidity. The rain remains rare as cloudy days become slightly more frequent compared to July, but sunshine still prevails. Weather in August »Weather in September
September represents a noticeable transitional weather phase in Hillsboro with temperatures beginning to cool, falling to an average high of around 73.9°F (23.3°C). The receding summer heat and the early onset of fall create a comfortable environment, allowing flora and fauna to thrive. Weather in September »Weather in October
October welcomes the vibrant fall with a sharp drop in temperatures, declining to a high ambient of approximately 61.2°F (16.2°C). As the landscape changes its color palette from lush greens to warm autumn hues, rainfall becomes more frequent, setting the stage for the forthcoming wet season. Weather in October »Weather in November
In November, Hillsboro witnesses the onset of winter with the rapid drop in temperature to an average maximum of around 50.7°F (10.4°C). With reduced sunshine hours, the skies are often cloudy, adding to the wintery feel. The noticeable increase in humidity combined with frequent rains echoes the introduction of the colder season. Weather in November »Weather in December
December brings the full force of winter to Hillsboro with an average high temperature of about 43.9°F (6.6°C) and an increase in rainfall to 4.45" (113mm) on average. The dwindling daylight hours, coupled with often cloudy skies and relatively high humidity, underline the chill factor. Weather in December »Published by: Weather U.S. | About Us
Data Sources | Weather Forecasting & Climate
Frequently asked questions
Average temperature
Hillsboro, OR
The warmest month (with the highest average high temperature) is August (81.5°F).
The month with the lowest average high temperature is December (43.9°F).
The month with the highest average low temperature is August (55.4°F).
The coldest month (with the lowest average low temperature) is December (34°F).
Average pressure
Hillsboro, OR
- Average pressure in January:
30.11"Hg - Average pressure in February:
30.07"Hg - Average pressure in March:
30.03"Hg - Average pressure in April:
30.07"Hg - Average pressure in May:
30.04"Hg - Average pressure in June:
30.04"Hg
- Average pressure in July:
30.04"Hg - Average pressure in August:
30.01"Hg - Average pressure in September:
30.01"Hg - Average pressure in October:
30.05"Hg - Average pressure in November:
30.06"Hg - Average pressure in December:
30.1"Hg
The month with the highest atmospheric pressure is January (30.11"Hg).
The months with the lowest atmospheric pressure are August and September (30.01"Hg).
Average wind speed
Hillsboro, OR
- Average wind speed in January:
4.9mph - Average wind speed in February:
4.9mph - Average wind speed in March:
5mph - Average wind speed in April:
4.8mph - Average wind speed in May:
4.4mph - Average wind speed in June:
4.3mph
- Average wind speed in July:
4.6mph - Average wind speed in August:
4.3mph - Average wind speed in September:
4.3mph - Average wind speed in October:
4.6mph - Average wind speed in November:
4.8mph - Average wind speed in December:
4.7mph
The windiest month (with the highest average wind speed) is March (5mph).
The calmest months (with the lowest average wind speed) are June, August and September (4.3mph).
Average humidity
Hillsboro, OR
The months with the highest relative humidity are January, February, November and December (85%).
The month with the lowest relative humidity is August (64%).
Average rainfall
Hillsboro, OR
- Average rainfall in January:
4.57" - Average rainfall in February:
3.19" - Average rainfall in March:
3.35" - Average rainfall in April:
2.64" - Average rainfall in May:
1.73" - Average rainfall in June:
1.1"
- Average rainfall in July:
0.39" - Average rainfall in August:
0.31" - Average rainfall in September:
1.46" - Average rainfall in October:
3.11" - Average rainfall in November:
3.19" - Average rainfall in December:
4.45"
The wettest month (with the highest rainfall) is January (4.57").
The driest month (with the least rainfall) is August (0.31").
Average rainfall days
Hillsboro, OR
- Average rainfall days in January:
18.8 days - Average rainfall days in February:
16.8 days - Average rainfall days in March:
20.8 days - Average rainfall days in April:
18.6 days - Average rainfall days in May:
13.6 days - Average rainfall days in June:
11.4 days
- Average rainfall days in July:
5.1 days - Average rainfall days in August:
4.4 days - Average rainfall days in September:
10.1 days - Average rainfall days in October:
15.9 days - Average rainfall days in November:
18.7 days - Average rainfall days in December:
18.8 days
The month with the highest number of rainy days is March (20.8 days).
The month with the least rainy days is August (4.4 days).
Average snowfall
Hillsboro, OR
The month with the highest snowfall is February (1.81").
The months with the least snowfall are April, May, June, July, August, September and October (0").
Average snowfall days
Hillsboro, OR
- Average snowfall days in January:
1.6 days - Average snowfall days in February:
2.4 days - Average snowfall days in March:
1.6 days - Average snowfall days in April:
0 days - Average snowfall days in May:
0 days - Average snowfall days in June:
0 days
- Average snowfall days in July:
0 days - Average snowfall days in August:
0 days - Average snowfall days in September:
0 days - Average snowfall days in October:
0 days - Average snowfall days in November:
0.3 days - Average snowfall days in December:
0.7 days
The month with the highest number of snowfall days is February (2.4 days).
The months with the least snowfall days are April, May, June, July, August, September and October (0 days).
Average daylight / Average sunshine
Hillsboro, OR
- Average daylight in January:
9h and 12min - Average daylight in February:
10h and 24min - Average daylight in March:
12h and 0min - Average daylight in April:
13h and 36min - Average daylight in May:
14h and 54min - Average daylight in June:
15h and 36min
- Average daylight in July:
15h and 18min - Average daylight in August:
14h and 6min - Average daylight in September:
12h and 30min - Average daylight in October:
10h and 54min - Average daylight in November:
9h and 30min - Average daylight in December:
8h and 48min
The month with the longest days is June (Average daylight: 15h and 36min).
The month with the shortest days is December (Average daylight: 8h and 48min).
- Average sunshine in January:
3h and 48min - Average sunshine in February:
3h and 42min - Average sunshine in March:
5h and 18min - Average sunshine in April:
7h and 0min - Average sunshine in May:
8h and 18min - Average sunshine in June:
8h and 54min
- Average sunshine in July:
10h and 30min - Average sunshine in August:
10h and 36min - Average sunshine in September:
8h and 54min - Average sunshine in October:
5h and 6min - Average sunshine in November:
4h and 18min - Average sunshine in December:
3h and 54min
The month with the most sunshine is August (Average sunshine: 10h and 36min).
The month with the least sunshine is February (Average sunshine: 3h and 42min).
Average sunshine days
Hillsboro, OR
- Average sunshine days in January:
10.8 days - Average sunshine days in February:
8.9 days - Average sunshine days in March:
8.5 days - Average sunshine days in April:
9 days - Average sunshine days in May:
16.2 days - Average sunshine days in June:
16.2 days
- Average sunshine days in July:
24.4 days - Average sunshine days in August:
24.3 days - Average sunshine days in September:
17.2 days - Average sunshine days in October:
14 days - Average sunshine days in November:
10.2 days - Average sunshine days in December:
10.5 days
The month with the most sunshine days is July (24.4 days).
The month with the least sunshine days is March (8.5 days).
Average UV index
Hillsboro, OR
The month with the highest UV index is July (UV index 6).
The months with the lowest UV index are January, February, November and December (UV index 2).
Average cloud cover
Hillsboro, OR
The month with the most cloud cover is February (Cloud cover 63).
The month with the least cloud cover is August (Cloud cover 25).
Average visibility
Hillsboro, OR
The months with the highest visibility are July, August and September (6mi).
The months with the lowest visibility are January and February (4mi).


