Climate and monthly weather forecastWalla Walla, WA
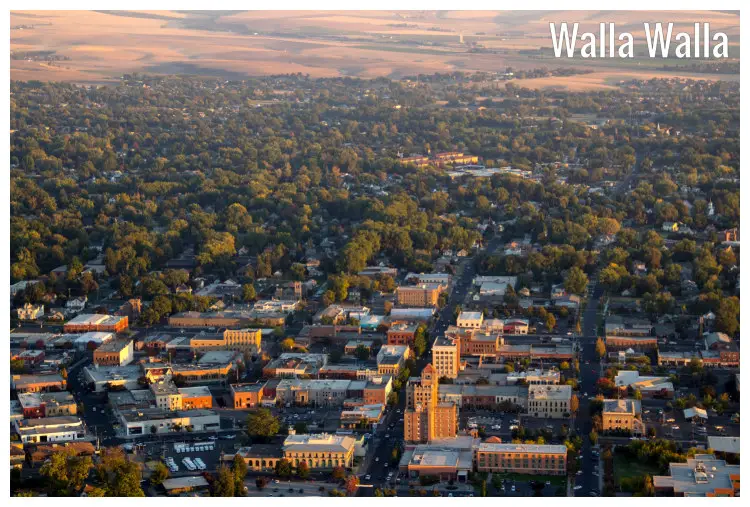
Climate and monthly weather forecast
The climate of Walla Walla
Walla Walla, Washington, resides within the Csa climatic category, as per the Köppen climate classification, indicating a Mediterranean climate with hot and dry summers. The city's position, nestled in the southeastern region of Washington State, gets to experience moderate temperatures throughout the year.Patterns in the city's weather fluctuate principally on seasonal bases. Peak temperatures, from June to August, average between 73.6°F (23.1°C) and 84.7°F (29.3°C). Lower temperatures are characteristic of December and January, rarely exceeding 37.4°F (3°C). The winter cold gets exacerbated by relative humidity values between 79% and 81% during these two months.
Rainfall in Walla Walla shows discernible year-round variability. A rainy period follows from February to April with averages from 1.61" (41mm) to 2.01" (51mm), while a drier phase transpires between June and August registering rainfall figures as minimal as 0.35" (9mm) to 0.39" (10mm). The span of daylight and sunshine hours also manifests a direct correlation with the changing seasons. Extended sunshine hours from May to August equate to higher UV indexes - up to 7 qualified on the UV intensity scale.
The best time to visit Walla Walla
Numerous factors can determine a visitor's preferred period to explore Walla Walla, most notably personal tolerance towards temperature and rainfall. However, many appreciate a warm and sunnier climate. This condition tends to unfold between May and September, making those months ideal for visiting Walla Walla. During this period, temperatures range from 56.8°F (13.8°C) to 84.6°F (29.2°C) coupled with ample sunshine hours (10.1h to 12.1h) and longer daylight hours (13.6h to 15.7h). Moreover, rain occurrences are far less frequent, with precipitation volumes from 0.35" (9mm) to 1.06" (27mm).The worst time to visit Walla Walla
The period from November to January could potentially deter tourists due to the colder temperatures spanning from 27°F (-2.8°C) to 37.4°F (3°C). The chilliness in combination with high humidity that hits a maximum of 81% can result in uncomfortable conditions. Snowfall can also be expected, peaking at 2.28" (58mm) in December. Moreover, the visibility, although stable throughout the year, can be notably affected during snowfalls and high humidity periods.Spring weather in Walla Walla
Walla Walla's springtime, stretching from March to May, comes with gradually warming temperature readings from 49.5°F (9.7°C) to 66.2°F (19°C). While the beginning of spring may experience some residual rainfall from the previous winter, the rainfall decreases towards May, averaging 1.65" (42mm). Meanwhile, humidity descends to a cooler 62%. Furthermore, the duration of sunlight hours and daylight extends, ranging from 12h to 15h and 7.5h to 10.9h respectively.Summer weather in Walla Walla
Summers in Walla Walla, from June to August, boast a hot Mediterranean profile. During these months, visitor's can expect daytime temperatures from 73.6°F (23.1°C) to 84.7°F (29.3°C). Indeed, this is the warmest period of the year. Correspondingly, pressure inches measurement remains stable around 29.92" (760mm). The summer season also enjoys low rainfall levels between 0.35" (9mm) and 0.39" (10mm).Autumn weather in Walla Walla
The descent into autumn from September to November sees temperatures receding from 74.3°F (23.5°C) to 46.9°F (8.3°C). At this time, visitors should be prepared for a gradual increase in rainfall indices, peaking at 1.38" (35mm) in November. However, the autumn season boasts significant daylight and sunshine hours, ranging from 9.5h to 12.5h and 6.2h to 10.5h, respectively.Winter weather in Walla Walla
The winter in Walla Walla, ranging from December to February, showcases cooler temperatures with lows of 28°F (-2.2°C), and highs up to 42.3°F (5.7°C). During these months, the city receives the most considerable rainfall and snowfall, rising to a peak of 1.93" (49mm) in December and 2.91" (74mm) in February, respectively. The winter months also reduce the daylight and sunshine hours, reaching their annual lows of 8.7h and 5.4h respectively during December. Therefore, visitors should anticipate shorter days and longer nights.Weather in January
January presents a chilly landscape in Walla, Washington, characterized by temperatures dipping to 28°F (-2.2°C). Snowfall graces the region during this time, cloaking it in a tranquil blanket of frosty sheen. Relatively limited daylight hours contribute to the brisk nature of the month. Weather in January »Weather in February
As winter marches on, February displays slightly warmer temperatures compared to January, though it's still firmly within the winter season. Early signs of spring typically remain concealed during this foggy and damp period. The showers from January linger, but snowfall decreases as the month progresses. Weather in February »Weather in March
March ushers in a significant warming transition. The end of the winter freeze becomes more palpable as snowfall decreases and average temperatures progressively rise. As the days grow longer, Walla slowly breaks away from the coat of winter and enters the phase of spring. Weather in March »Weather in April
April carries the torch of spring in Walla with noticeably warmer weather and plentiful sun. The cold months dissolve into memory as vibrant blossoms start to decorate the city. Sunshine graces the sky for a longer duration, adding warmth and a touch of charm to the landscape. Weather in April »Weather in May
May marks the height of spring in Walla, with temperatures rising and clear skies dominating the weather pattern. Long daylight hours and resplendent sunshine create picturesque days, perfect for outdoor activities. This pleasant month is characterized by sprightly breezes and a noticeable uptick in humidity. Weather in May »Weather in June
June delivers the advent of summer to Walla with hotter temperatures and extended daylight hours. The transition from spring to summer is well underway as the sun intensifies and the days grow longer. Evening breezes offer a respite from daytime heat, making evenings in June comfortably pleasant. Weather in June »Weather in July
July, the warmest month, introduces the height of summer with the mercury hitting a high of 84.7°F (29.3°C). Stretches of clear, sunny days, coupled with significantly reduced rainfall, mark the dominance of the sun in Walla's July climate. Weather in July »Weather in August
August paves the way for hot and dry summer weather with consistent high temperatures akin to July’s 84.6°F (29.2°C). The city relishes in glorious sunny days, marked by minimal clouds and wide blue skies. While vegetation flourishes thanks to accumulated spring rainfall, August's own rainfall is notably minimal. Weather in August »Weather in September
September signifies the commencement of autumn, exhibiting a reduction in temperature from the summer months. Unwavering sunshine makes the transition from summer to fall smooth, creating days that are warm and nights that are comfortably cool. Weather in September »Weather in October
October exudes full autumn charm as temperatures cool down and leaves turn into brilliant hues of red, orange, and yellow. Harvest season picks up, enhancing the region's agrarian charm. Rainfall levels start to rise, presenting wetter and cooler days than the previous month. Weather in October »Weather in November
November marches in as a pronounced transition to the colder months. Walla begins to put on its winter attire as temperatures drop and days shorten. Frequent overcast skies are a sign that the rainy season is in full swing. Along with cooler temperatures, winds gain speed, adding a chill to the ambient temperature. Weather in November »Weather in December
December is a month of colder weather and less sunshine as it marks official winter onset. Faint traces of snow may embellish the surroundings, giving Walla a classic wintry charm. Sunlit hours wane as the winter solstice approaches, signaling the year's shortest day with regard to sunlight. Weather in December »Published by: Weather U.S. | About Us
Data Sources | Weather Forecasting & Climate
Frequently asked questions
Average temperature
Walla Walla, WA
The warmest month (with the highest average high temperature) is July (84.7°F).
The month with the lowest average high temperature is December (37.4°F).
The month with the highest average low temperature is August (60.8°F).
The coldest month (with the lowest average low temperature) is December (27°F).
Average pressure
Walla Walla, WA
- Average pressure in January:
30.2"Hg - Average pressure in February:
30.1"Hg - Average pressure in March:
30.02"Hg - Average pressure in April:
30"Hg - Average pressure in May:
29.94"Hg - Average pressure in June:
29.92"Hg
- Average pressure in July:
29.92"Hg - Average pressure in August:
29.9"Hg - Average pressure in September:
29.95"Hg - Average pressure in October:
30.04"Hg - Average pressure in November:
30.1"Hg - Average pressure in December:
30.17"Hg
The month with the highest atmospheric pressure is January (30.2"Hg).
The month with the lowest atmospheric pressure is August (29.9"Hg).
Average wind speed
Walla Walla, WA
- Average wind speed in January:
6.3mph - Average wind speed in February:
6.6mph - Average wind speed in March:
7.6mph - Average wind speed in April:
7.9mph - Average wind speed in May:
6.7mph - Average wind speed in June:
7mph
- Average wind speed in July:
6.5mph - Average wind speed in August:
6.2mph - Average wind speed in September:
5.9mph - Average wind speed in October:
6.2mph - Average wind speed in November:
6.6mph - Average wind speed in December:
6.2mph
The windiest month (with the highest average wind speed) is April (7.9mph).
The calmest month (with the lowest average wind speed) is September (5.9mph).
Average humidity
Walla Walla, WA
The month with the highest relative humidity is January (81%).
The month with the lowest relative humidity is August (39%).
Average rainfall
Walla Walla, WA
- Average rainfall in January:
1.73" - Average rainfall in February:
1.61" - Average rainfall in March:
2.01" - Average rainfall in April:
1.26" - Average rainfall in May:
1.65" - Average rainfall in June:
1.06"
- Average rainfall in July:
0.35" - Average rainfall in August:
0.39" - Average rainfall in September:
0.55" - Average rainfall in October:
1.18" - Average rainfall in November:
1.38" - Average rainfall in December:
1.93"
The wettest month (with the highest rainfall) is March (2.01").
The driest month (with the least rainfall) is July (0.35").
Average rainfall days
Walla Walla, WA
- Average rainfall days in January:
14.3 days - Average rainfall days in February:
13.3 days - Average rainfall days in March:
17.4 days - Average rainfall days in April:
15.3 days - Average rainfall days in May:
13.8 days - Average rainfall days in June:
10.3 days
- Average rainfall days in July:
4.9 days - Average rainfall days in August:
5.6 days - Average rainfall days in September:
7.6 days - Average rainfall days in October:
12 days - Average rainfall days in November:
13.3 days - Average rainfall days in December:
13.9 days
The month with the highest number of rainy days is March (17.4 days).
The month with the least rainy days is July (4.9 days).
Average snowfall
Walla Walla, WA
The month with the highest snowfall is February (2.91").
The months with the least snowfall are May, June, July, August and October (0").
Average snowfall days
Walla Walla, WA
- Average snowfall days in January:
4.3 days - Average snowfall days in February:
6.1 days - Average snowfall days in March:
2.4 days - Average snowfall days in April:
0.5 days - Average snowfall days in May:
0 days - Average snowfall days in June:
0 days
- Average snowfall days in July:
0 days - Average snowfall days in August:
0 days - Average snowfall days in September:
0.1 days - Average snowfall days in October:
0.1 days - Average snowfall days in November:
1.5 days - Average snowfall days in December:
6.1 days
The months with the highest number of snowfall days are February and December (6.1 days).
The months with the least snowfall days are May, June, July and August (0 days).
Average daylight / Average sunshine
Walla Walla, WA
- Average daylight in January:
9h and 6min - Average daylight in February:
10h and 24min - Average daylight in March:
12h and 0min - Average daylight in April:
13h and 36min - Average daylight in May:
15h and 0min - Average daylight in June:
15h and 42min
- Average daylight in July:
15h and 18min - Average daylight in August:
14h and 6min - Average daylight in September:
12h and 30min - Average daylight in October:
10h and 54min - Average daylight in November:
9h and 30min - Average daylight in December:
8h and 42min
The month with the longest days is June (Average daylight: 15h and 42min).
The month with the shortest days is December (Average daylight: 8h and 42min).
- Average sunshine in January:
5h and 18min - Average sunshine in February:
5h and 30min - Average sunshine in March:
7h and 30min - Average sunshine in April:
10h and 6min - Average sunshine in May:
10h and 54min - Average sunshine in June:
11h and 18min
- Average sunshine in July:
12h and 0min - Average sunshine in August:
12h and 6min - Average sunshine in September:
10h and 30min - Average sunshine in October:
7h and 0min - Average sunshine in November:
6h and 12min - Average sunshine in December:
5h and 24min
The month with the most sunshine is August (Average sunshine: 12h and 6min).
The month with the least sunshine is January (Average sunshine: 5h and 18min).
Average sunshine days
Walla Walla, WA
- Average sunshine days in January:
12.8 days - Average sunshine days in February:
10 days - Average sunshine days in March:
11.5 days - Average sunshine days in April:
12 days - Average sunshine days in May:
14.3 days - Average sunshine days in June:
17.6 days
- Average sunshine days in July:
24.4 days - Average sunshine days in August:
21.8 days - Average sunshine days in September:
20.1 days - Average sunshine days in October:
17.4 days - Average sunshine days in November:
14.4 days - Average sunshine days in December:
13.1 days
The month with the most sunshine days is July (24.4 days).
The month with the least sunshine days is February (10 days).
Average UV index
Walla Walla, WA
The month with the highest UV index is July (UV index 7).
The months with the lowest UV index are January, February, November and December (UV index 2).
Average cloud cover
Walla Walla, WA
The months with the most cloud cover are January, February and December (Cloud cover 44).
The months with the least cloud cover are July and August (Cloud cover 10).
Average visibility
Walla Walla, WA
The months with the highest visibility are January, February, March, April, May, June, July, August, September, October, November and December (6mi).
The months with the lowest visibility are January, February, March, April, May, June, July, August, September, October, November and December (6mi).


