August weather forecastHayward, CA
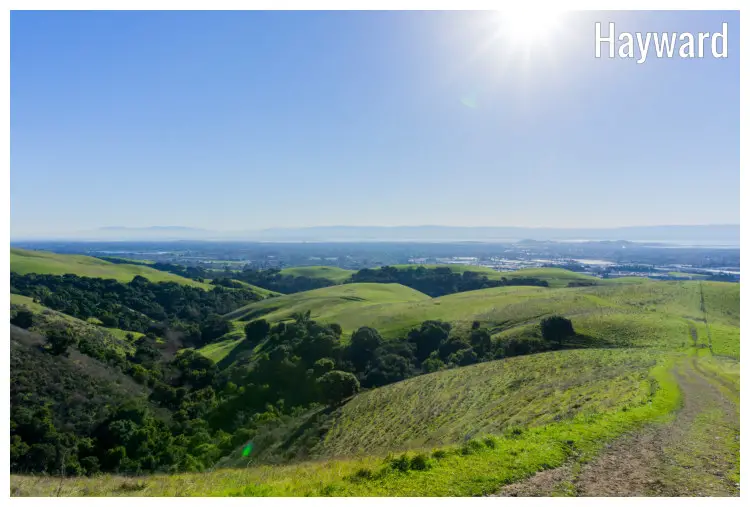
August
Weather in August
August continues the hot weather pattern in Hayward, although temperatures witness a slight dip from July highs. The city experiences minimal rain, essentially continuing the dry spell, while relative humidity increases marginally. The number of daylight hours starts to decrease, signifying the upcoming fall season, but the city enjoys ample sunshine during these hours. August sustains summer's eliminating impact on cloud manifestations, with cloud coverage remaining at a low 8%. The calm wind speeds provide no substantial deviation from the typical summer pattern.Temperature
The onset of August marks an average high-temperature of a still moderately hot 79.7°F (26.5°C), hardly differing from July's 80.2°F (26.8°C). Hayward registers a prominent dip from daytime highs, with an average of 56.5°F (13.6°C) during the nights of August.Humidity
In August, the average relative humidity is 65%.Rainfall
The months with the least rainfall are July and August Rain falls for 0.9 days and accumulates 0.04" (1mm) of rain.Daylight
In August, the average length of the day is 13h and 34min.On the first day of August in Hayward, sunrise is at 6:12 am and sunset at 8:16 pm. On the last day of the month, sunrise is at 6:38 am and sunset at 7:38 pm PDT.
Sunshine
In Hayward, the average sunshine in August is 12h.UV index
The average daily maximum UV index in August is 5. A UV Index value of 3 to 5 symbolizes a moderate health risk from unprotected exposure to Sun's UV rays for ordinary individuals.Note: The average daily UV index of 5 in August transforms into the following instructions:
Make use of precautions - It is urged to ward off sun damage. The Sun's UV radiation is especially harmful around midday, so reduce exposure and stay safe. Sun protection is enhanced with clothing that boasts a tight weave yet offers a loose fit.
Published by: Weather U.S. | About Us
Data Sources | Weather Forecasting & Climate
Frequently asked questions
Average temperature in August
Hayward, CA
- Average high temperature in August: 79.7°F
The warmest month (with the highest average high temperature) is July (80.2°F).
The month with the lowest average high temperature is December (55.9°F).
- Average low temperature in August: 56.5°F
The month with the highest average low temperature is August (56.5°F).
The coldest months (with the lowest average low temperature) are January and December (43.7°F).
Average pressure in August
Hayward, CA
- Average pressure in August: 29.92"Hg
The month with the highest atmospheric pressure is January (30.14"Hg).
The months with the lowest atmospheric pressure are June, August and September (29.92"Hg).
Average wind speed in August
Hayward, CA
- Average wind speed in August: 5.4mph
The windiest month (with the highest average wind speed) is May (6.6mph).
The calmest month (with the lowest average wind speed) is November (4.6mph).
Average humidity in August
Hayward, CA
- Average humidity in August: 65%
The month with the highest relative humidity is March (74%).
The month with the lowest relative humidity is September (61%).
Average rainfall in August
Hayward, CA
- Average rainfall in August: 0.04"
The wettest month (with the highest rainfall) is February (2.28").
The driest months (with the least rainfall) are July and August (0.04").
Average rainfall days in August
Hayward, CA
- Average rainfall days in August: 0.9 days
The month with the highest number of rainy days is March (12.4 days).
The month with the least rainy days is August (0.9 days).
Average daylight in August /
Average sunshine in August
Hayward, CA
- Average daylight in August: 13h and 36min
The month with the longest days is June (Average daylight: 14h and 42min).
The month with the shortest days is December (Average daylight: 9h and 36min).
- Average sunshine in August: 12h and 0min
The month with the most sunshine is July (Average sunshine: 12h and 6min).
The month with the least sunshine is December (Average sunshine: 5h and 54min).
Average sunshine days in August
Hayward, CA
- Average sunshine days in August: 28.9 days
The month with the most sunshine days is August (28.9 days).
The month with the least sunshine days is March (17.3 days).
Average UV index in August
Hayward, CA
- Average UV index in August: 5
The month with the highest UV index is June (UV index 6).
The months with the lowest UV index are January, February, November and December (UV index 3).
Average cloud cover in August
Hayward, CA
- Average cloud cover in August: 8
The months with the most cloud cover are March and December (Cloud cover 34).
The month with the least cloud cover is July (Cloud cover 7).
Average visibility in August
Hayward, CA
- Average visibility in August: 6mi
The months with the highest visibility are January, February, March, April, May, June, July, August, September, October, November and December (6mi).
The months with the lowest visibility are January, February, March, April, May, June, July, August, September, October, November and December (6mi).


