March weather forecastHayward, CA
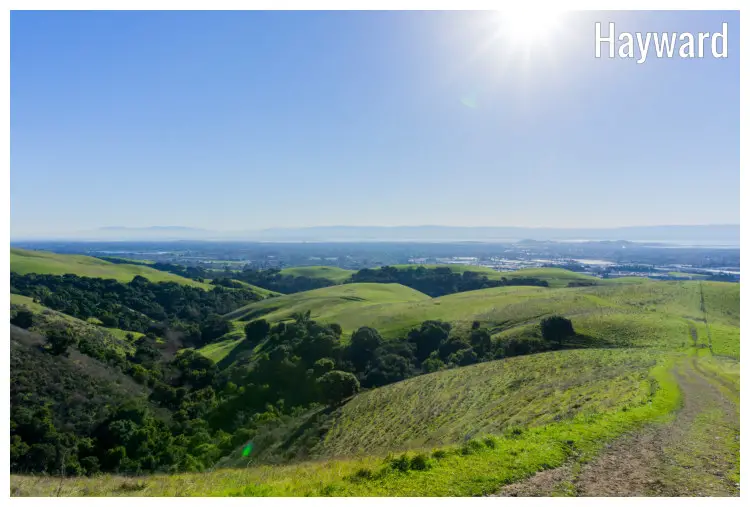
March
Weather in March
March signifies the official arrival of spring in Hayward, bringing with it an uptick in temperatures. The rainfall heads into a sustained decrease which lasts till summer while relative humidity increases slightly. The lengthening days open windows for more sunshine hours while wind speeds reach annual highs. In March, Hayward registers an increased number of rainy days, recording 12.4 days. Witnessing a seesaw of weather characteristics, March stands as a transition from rainfall-rich to drier months.Temperature
Upon the onset of March, Hayward witnesses an average high-temperature of a still refreshing 61.9°F (16.6°C), showing a close resemblance to the prior month. March witnesses an average nighttime temperature of 45°F (7.2°C).Humidity
March is the most humid month, with an average relative humidity of 74%.Rainfall
In Hayward, in March, it is raining for 12.4 days, with typically 1.81" (46mm) of accumulated precipitation. In Hayward, during the entire year, the rain falls for 69.2 days and collects up to 11.1" (282mm) of precipitation.Daylight
The average length of the day in March in Hayward is 11h and 59min.On the first day of March, sunrise is at 6:38 am and sunset at 6:02 pm PST. On the last day of the month, sunrise is at 6:53 am and sunset at 7:30 pm PDT.
Note: On Sunday, March 10. 2024, at 2:00 am, Daylight Saving Time starts, and the time zone changes from PST to PDT. Daylight Saving Time lasts until Sunday, November 3. 2024, at 2:00 am; consequently, the time zone reverts from PDT to PST.
Sunshine
In Hayward, the average sunshine in March is 8h.UV index
The average daily maximum UV index in March in Hayward is 4. A UV Index reading of 3 to 5 represents a moderate health risk from exposure to the Sun's UV radiation for the ordinary person.Note: The maximum daily UV index of 4 in March interprets into the following recommendations:
Take care. Persons with lighter skin might suffer burns in less than 30 minutes. UV radiation from the Sun is most dangerous during midday; take precautions and seek shade. To cut down UV radiation exposure by about half, sport a wide-brim hat.
Published by: Weather U.S. | About Us
Data Sources | Weather Forecasting & Climate
Frequently asked questions
Average temperature in March
Hayward, CA
- Average high temperature in March: 61.9°F
The warmest month (with the highest average high temperature) is July (80.2°F).
The month with the lowest average high temperature is December (55.9°F).
- Average low temperature in March: 45°F
The month with the highest average low temperature is August (56.5°F).
The coldest months (with the lowest average low temperature) are January and December (43.7°F).
Average pressure in March
Hayward, CA
- Average pressure in March: 30.07"Hg
The month with the highest atmospheric pressure is January (30.14"Hg).
The months with the lowest atmospheric pressure are June, August and September (29.92"Hg).
Average wind speed in March
Hayward, CA
- Average wind speed in March: 6mph
The windiest month (with the highest average wind speed) is May (6.6mph).
The calmest month (with the lowest average wind speed) is November (4.6mph).
Average humidity in March
Hayward, CA
- Average humidity in March: 74%
The month with the highest relative humidity is March (74%).
The month with the lowest relative humidity is September (61%).
Average rainfall in March
Hayward, CA
- Average rainfall in March: 1.81"
The wettest month (with the highest rainfall) is February (2.28").
The driest months (with the least rainfall) are July and August (0.04").
Average rainfall days in March
Hayward, CA
- Average rainfall days in March: 12.4 days
The month with the highest number of rainy days is March (12.4 days).
The month with the least rainy days is August (0.9 days).
Average daylight in March /
Average sunshine in March
Hayward, CA
- Average daylight in March: 12h and 0min
The month with the longest days is June (Average daylight: 14h and 42min).
The month with the shortest days is December (Average daylight: 9h and 36min).
- Average sunshine in March: 8h and 0min
The month with the most sunshine is July (Average sunshine: 12h and 6min).
The month with the least sunshine is December (Average sunshine: 5h and 54min).
Average sunshine days in March
Hayward, CA
- Average sunshine days in March: 17.3 days
The month with the most sunshine days is August (28.9 days).
The month with the least sunshine days is March (17.3 days).
Average UV index in March
Hayward, CA
- Average UV index in March: 4
The month with the highest UV index is June (UV index 6).
The months with the lowest UV index are January, February, November and December (UV index 3).
Average cloud cover in March
Hayward, CA
- Average cloud cover in March: 34
The months with the most cloud cover are March and December (Cloud cover 34).
The month with the least cloud cover is July (Cloud cover 7).
Average visibility in March
Hayward, CA
- Average visibility in March: 6mi
The months with the highest visibility are January, February, March, April, May, June, July, August, September, October, November and December (6mi).
The months with the lowest visibility are January, February, March, April, May, June, July, August, September, October, November and December (6mi).


