February weather forecastBurlington, IA
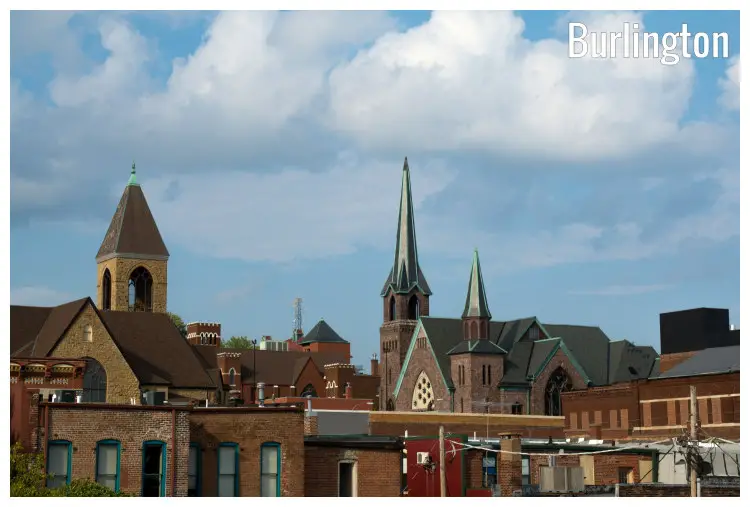
February
Weather in February
In February, temperatures in Burlington start to rise slightly from its January lows. Still below the freezing mark, the city sees an increase in daylight hours, offering slightly more time under the sun. The presence of snow lessens, with amounts dropping from 4.25" (108mm) in January to 2.72" (69mm). The feeling of winter gradually giving way to spring begins to permeate the air as February progresses. Sunshine casts longer shadows, promising more warmth in the days to come.Temperature
The beginning of February records an average high-temperature of a wintry 35.1°F (1.7°C), almost echoing the conditions of the previous month. Throughout the nights in February, Burlington experiences an average low-temperature of 21.7°F (-5.7°C).Humidity
In Burlington, the average relative humidity in February is 80%.Rainfall
In Burlington, during February, the rain falls for 5.2 days and regularly aggregates up to 1.38" (35mm) of precipitation. Throughout the year, there are 137.6 rainfall days, and 26.65" (677mm) of precipitation is accumulated.Snowfall
January through April, October through December are months with snowfall. In Burlington, Iowa, during February, snow falls for 7.3 days and regularly aggregates up to 2.72" (69mm) of snow. Throughout the year, in Burlington, there are 29.5 snowfall days, and 11.77" (299mm) of snow is accumulated.Daylight
In February, the average length of the day is 10h and 40min.On the first day of February in Burlington, sunrise is at 7:14 am and sunset at 5:21 pm. On the last day of the month, sunrise is at 6:38 am and sunset at 5:55 pm CST.
Sunshine
In February, the average sunshine in Burlington is 4.5h.UV index
In February, the average daily maximum UV index in Burlington is 2. A UV Index of 2, and less, symbolizes a low health risk from unsafe exposure to UV radiation for ordinary individuals.Note: The maximum daily UV index, 2 in February, converts into the following recommendations:
Extended exposure to the sun should always be avoided by children, infants, and those with sensitive skin. Avoid the Sun's strongest UV rays by seeking shade and limiting exposure during midday. Stay sun-safe with clothing that is both closely woven and worn loosely. Take to heart! Snow reflection can almost magnify the Sun's UV radiation twofold.
Published by: Weather U.S. | About Us
Data Sources | Weather Forecasting & Climate
Frequently asked questions
Average temperature in February
Burlington, IA
- Average high temperature in February: 35.1°F
The warmest month (with the highest average high temperature) is July (82.4°F).
The month with the lowest average high temperature is January (30°F).
- Average low temperature in February: 21.7°F
The month with the highest average low temperature is July (65.7°F).
The coldest month (with the lowest average low temperature) is January (18°F).
Average pressure in February
Burlington, IA
- Average pressure in February: 30.12"Hg
The month with the highest atmospheric pressure is January (30.14"Hg).
The month with the lowest atmospheric pressure is June (29.9"Hg).
Average wind speed in February
Burlington, IA
- Average wind speed in February: 10.4mph
The windiest month (with the highest average wind speed) is January (10.6mph).
The calmest months (with the lowest average wind speed) are July and August (6.7mph).
Average humidity in February
Burlington, IA
- Average humidity in February: 80%
The month with the highest relative humidity is July (83%).
The month with the lowest relative humidity is October (70%).
Average rainfall in February
Burlington, IA
- Average rainfall in February: 1.38"
The wettest month (with the highest rainfall) is May (3.94").
The driest month (with the least rainfall) is December (1.3").
Average rainfall days in February
Burlington, IA
- Average rainfall days in February: 5.2 days
The month with the highest number of rainy days is May (17.8 days).
The month with the least rainy days is February (5.2 days).
Average snowfall in February
Burlington, IA
- Average snowfall in February: 2.72"
The month with the highest snowfall is January (4.25").
The months with the least snowfall are May, June, July, August and September (0").
Average snowfall days in February
Burlington, IA
- Average snowfall days in February: 7.3 days
The month with the highest number of snowfall days is January (9.8 days).
The months with the least snowfall days are May, June, July, August and September (0 days).
Average daylight in February /
Average sunshine in February
Burlington, IA
- Average daylight in February: 10h and 42min
The month with the longest days is June (Average daylight: 15h and 6min).
The month with the shortest days is December (Average daylight: 9h and 18min).
- Average sunshine in February: 4h and 30min
The months with the most sunshine are June and July (Average sunshine: 10h and 18min).
The month with the least sunshine is January (Average sunshine: 4h and 12min).
Average sunshine days in February
Burlington, IA
- Average sunshine days in February: 16.8 days
The months with the most sunshine days are October and November (19.3 days).
The month with the least sunshine days is June (10.3 days).
Average UV index in February
Burlington, IA
- Average UV index in February: 2
The months with the highest UV index are June and July (UV index 6).
The month with the lowest UV index is January (UV index 1).
Average cloud cover in February
Burlington, IA
- Average cloud cover in February: 52
The month with the most cloud cover is January (Cloud cover 54).
The months with the least cloud cover are July, August and September (Cloud cover 29).
Average visibility in February
Burlington, IA
- Average visibility in February: 6mi
The months with the highest visibility are January, February, March, April, May, June, July, August, September, October, November and December (6mi).
The months with the lowest visibility are January, February, March, April, May, June, July, August, September, October, November and December (6mi).


