October weather forecastVancouver, WA
October
Weather in October
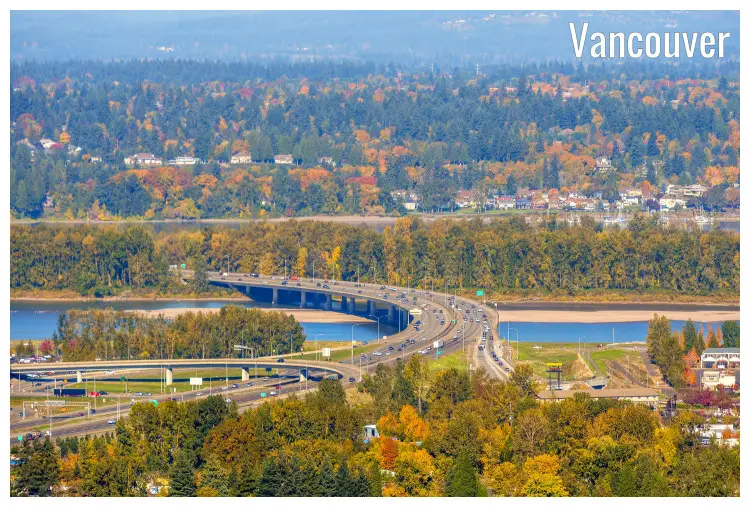
October heralds a significant change in weather patterns in Vancouver, Washington, as the city fully embraces fall. A covering of golden leaves adds a touch of beauty to the cityscape, making autumn one of the city's most picturesque times. The city gets just a smattering of rain enough to cool things down, without the constant drizzle that could become bothersome. Yet, with average wind speeds up to 4.5mph (7.2km/h), a sense of chill begins to fill the air, a reminder that winter is on its way.Temperature
Vancouver's October weather comes with a decrease in average high-temperatures, moving from an agreeable 73°F (22.8°C) in September to a comfortable 60.8°F (16°C). Nighttime temperature lowers to an average of 45.1°F (7.3°C) in October.Humidity
In Vancouver, the average relative humidity in October is 77%.Rainfall
In October, the rain falls for 15.8 days. Throughout October, 3.78" (96mm) of precipitation is accumulated. In Vancouver, during the entire year, the rain falls for 177.1 days and collects up to 34.29" (871mm) of precipitation.Snowfall
In Vancouver, snow does not fall in April through October.Daylight
The average length of the day in October is 10h and 55min.On the first day of the month, sunrise is at 7:10 am and sunset at 6:50 pm. On the last day of October, sunrise is at 7:50 am and sunset at 5:58 pm PDT.
Sunshine
In Vancouver, the average sunshine in October is 5.4h.UV index
In Vancouver, the average daily maximum UV index in October is 3. A UV Index of 3 to 5 symbolizes a moderate threat to health from unsafe exposure to UV radiation for average individuals.Note: A typical high UV index of 3 in October suggests the following recommendations:
Proceed with care. Light skin individuals may be exposed to burns in fewer than 30 minutes. UV radiation from the Sun is most dangerous during midday; take precautions and seek shade. Outfit yourself in sun-safe attire, like long sleeves, pants, a hat, and UV-blocking sunglasses.
Published by: Weather U.S. | About Us
Data Sources | Weather Forecasting & Climate
Frequently asked questions
Average temperature in October
Vancouver, WA
- Average high temperature in October: 60.8°F
The warmest month (with the highest average high temperature) is August (80.6°F).
The month with the lowest average high temperature is December (43.7°F).
- Average low temperature in October: 45.1°F
The month with the highest average low temperature is August (54°F).
The coldest month (with the lowest average low temperature) is December (34°F).
Average pressure in October
Vancouver, WA
- Average pressure in October: 30.05"Hg
The month with the highest atmospheric pressure is January (30.11"Hg).
The month with the lowest atmospheric pressure is August (30"Hg).
Average wind speed in October
Vancouver, WA
- Average wind speed in October: 4.5mph
The windiest month (with the highest average wind speed) is January (5.5mph).
The calmest month (with the lowest average wind speed) is August (3.8mph).
Average humidity in October
Vancouver, WA
- Average humidity in October: 77%
The months with the highest relative humidity are January and February (84%).
The month with the lowest relative humidity is August (65%).
Average rainfall in October
Vancouver, WA
- Average rainfall in October: 3.78"
The wettest month (with the highest rainfall) is December (5.08").
The driest month (with the least rainfall) is July (0.35").
Average rainfall days in October
Vancouver, WA
- Average rainfall days in October: 15.8 days
The month with the highest number of rainy days is March (20.6 days).
The month with the least rainy days is August (4.9 days).
Average snowfall in October
Vancouver, WA
- Average snowfall in October: 0"
The month with the highest snowfall is February (1.42").
The months with the least snowfall are April, May, June, July, August, September and October (0").
Average snowfall days in October
Vancouver, WA
- Average snowfall days in October: 0 days
The month with the highest number of snowfall days is February (2.1 days).
The months with the least snowfall days are April, May, June, July, August, September and October (0 days).
Average daylight in October /
Average sunshine in October
Vancouver, WA
- Average daylight in October: 10h and 54min
The month with the longest days is June (Average daylight: 15h and 36min).
The month with the shortest days is December (Average daylight: 8h and 48min).
- Average sunshine in October: 5h and 24min
The month with the most sunshine is August (Average sunshine: 11h and 0min).
The months with the least sunshine are January and February (Average sunshine: 4h and 6min).
Average sunshine days in October
Vancouver, WA
- Average sunshine days in October: 14 days
The month with the most sunshine days is July (24.1 days).
The month with the least sunshine days is February (7.9 days).
Average UV index in October
Vancouver, WA
- Average UV index in October: 3
The month with the highest UV index is July (UV index 6).
The months with the lowest UV index are January, February, November and December (UV index 2).
Average cloud cover in October
Vancouver, WA
- Average cloud cover in October: 43
The month with the most cloud cover is February (Cloud cover 58).
The month with the least cloud cover is August (Cloud cover 23).
Average visibility in October
Vancouver, WA
- Average visibility in October: 5mi
The months with the highest visibility are July, August and September (6mi).
The months with the lowest visibility are January, February, March, April, May, June, October, November and December (5mi).


