September weather forecastAppleton, WI
September
Weather in September
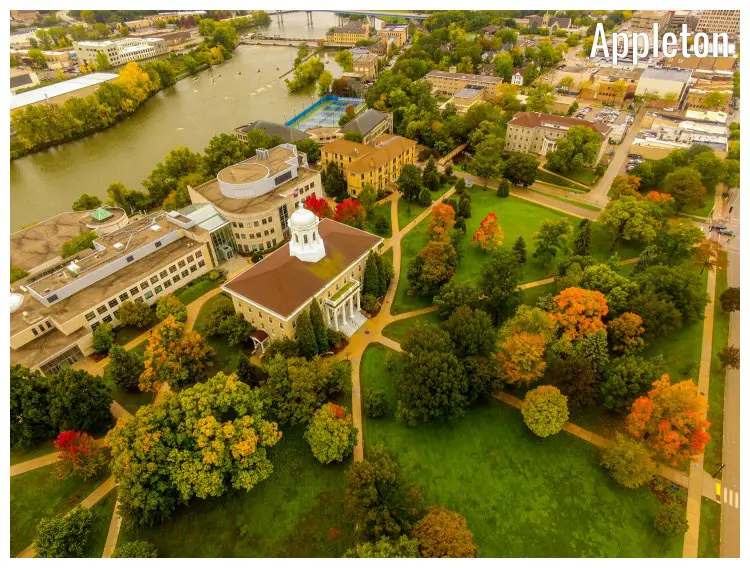
The arrival of September heralds a gradual shift from sultry summer to the freshness of fall in Appleton. Temperatures start to decline, slipping from 70.2°F (21.2°C) to make way for the cooler autumnal months. Despite the decrease, weather conditions remain pleasant and comfortable for outdoor activities. Appleton's streets come alive with fall-themed festivals and events. The city witnesses a drop in daylight hours to about 12.5 on average as days begin to shorten.Temperature
As August shifts into September in Appleton, a minor alteration in temperatures is observed, with average highs reducing from a warm 77.4°F (25.2°C) to an agreeable 70.2°F (21.2°C). An average temperature of 52°F (11.1°C) is recorded in Appleton during the nights in September.Humidity
The average relative humidity in September is 79%.Rainfall
In Appleton, Wisconsin, in September, it is raining for 12.1 days, with typically 1.81" (46mm) of accumulated precipitation. Throughout the year, there are 131.1 rainfall days, and 24.45" (621mm) of precipitation is accumulated.Snowfall
In Appleton, snow does not fall in June through September.Daylight
The average length of the day in September is 12h and 30min.On the first day of September in Appleton, sunrise is at 6:17 am and sunset at 7:29 pm. On the last day of the month, sunrise is at 6:51 am and sunset at 6:35 pm CDT.
Sunshine
The average sunshine in September is 8.5h.UV index
The average daily maximum UV index in September in Appleton is 3. A UV Index of 3 to 5 symbolizes a moderate threat to health from exposure to the Sun's UV rays for ordinary individuals.Note: An average UV index of 3 in September transforms into this advice:
Exercise care. People with light skin might get burns in fewer than 30 minutes. The Sun's UV radiation is especially harmful around midday, so reduce exposure and stay safe. A wide-brimmed hat is a shield, deflecting up to 50% of harmful UV radiation from eyes.
Published by: Weather U.S. | About Us
Data Sources | Weather Forecasting & Climate
Frequently asked questions
Average temperature in September
Appleton, WI
- Average high temperature in September: 70.2°F
The warmest month (with the highest average high temperature) is July (78.4°F).
The month with the lowest average high temperature is January (21.9°F).
- Average low temperature in September: 52°F
The month with the highest average low temperature is July (61.2°F).
The coldest month (with the lowest average low temperature) is January (10.8°F).
Average pressure in September
Appleton, WI
- Average pressure in September: 30.02"Hg
The months with the highest atmospheric pressure are January, February and March (30.09"Hg).
The month with the lowest atmospheric pressure is June (29.91"Hg).
Average wind speed in September
Appleton, WI
- Average wind speed in September: 7.9mph
The windiest month (with the highest average wind speed) is April (9.9mph).
The calmest months (with the lowest average wind speed) are July and August (7.1mph).
Average humidity in September
Appleton, WI
- Average humidity in September: 79%
The months with the highest relative humidity are January and February (88%).
The month with the lowest relative humidity is April (75%).
Average rainfall in September
Appleton, WI
- Average rainfall in September: 1.81"
The wettest month (with the highest rainfall) is May (3.54").
The driest month (with the least rainfall) is February (1.06").
Average rainfall days in September
Appleton, WI
- Average rainfall days in September: 12.1 days
The month with the highest number of rainy days is May (15.9 days).
The month with the least rainy days is January (3.9 days).
Average snowfall in September
Appleton, WI
- Average snowfall in September: 0"
The month with the highest snowfall is January (5.79").
The months with the least snowfall are June, July, August and September (0").
Average snowfall days in September
Appleton, WI
- Average snowfall days in September: 0 days
The month with the highest number of snowfall days is January (14.2 days).
The months with the least snowfall days are June, July, August and September (0 days).
Average daylight in September /
Average sunshine in September
Appleton, WI
- Average daylight in September: 12h and 30min
The month with the longest days is June (Average daylight: 15h and 30min).
The month with the shortest days is December (Average daylight: 8h and 54min).
- Average sunshine in September: 8h and 30min
The month with the most sunshine is July (Average sunshine: 10h and 6min).
The month with the least sunshine is January (Average sunshine: 3h and 24min).
Average sunshine days in September
Appleton, WI
- Average sunshine days in September: 16.4 days
The month with the most sunshine days is September (16.4 days).
The month with the least sunshine days is April (11.8 days).
Average UV index in September
Appleton, WI
- Average UV index in September: 3
The months with the highest UV index are May, June, July and August (UV index 5).
The months with the lowest UV index are January, November and December (UV index 1).
Average cloud cover in September
Appleton, WI
- Average cloud cover in September: 35
The month with the most cloud cover is January (Cloud cover 63).
The month with the least cloud cover is July (Cloud cover 32).
Average visibility in September
Appleton, WI
- Average visibility in September: 6mi
The months with the highest visibility are March, April, May, June, July, August, September, October and November (6mi).
The months with the lowest visibility are January, February and December (5mi).


