Climate and monthly weather forecastVentura, CA
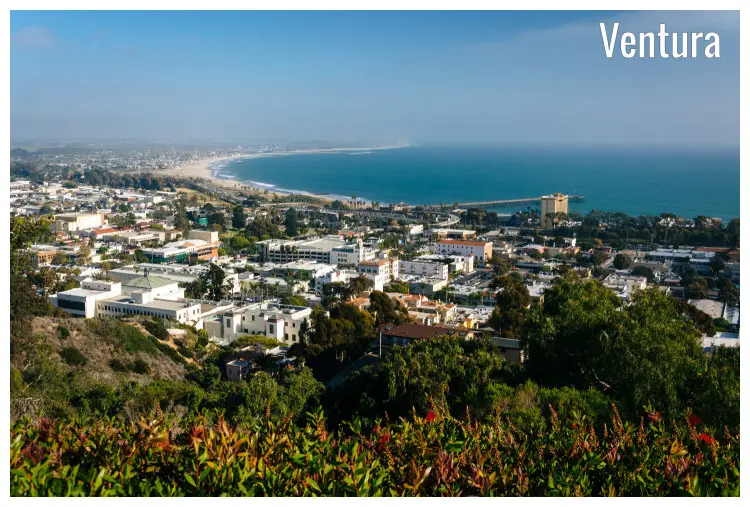
Climate and monthly weather forecast
The climate of Ventura
Ventura, situated in California, USA, is classified under the Köppen climate classification as Csb. This predominantly represents a Mediterranean climate distinguished by warm summers. A closer examination of the weather parameters throughout the year unveils a pattern of mild, comfortable temperatures interspersed with moderate levels of humidity and rainfall.Examining the climatic averages, the highest monthly temperatures hover around 74.3°F (23.5°C) observed in both July and August while the lowest temperatures range from 48.9°F (9.4°C) to 50.4°F (10.2°C) in the initial months of the year. Humidity levels display a mild increment in the middle of the year, peaking at 69% in the months of June and July. Nonetheless, the variation in relative humidity is quite minor, thus ensuring overall comfort throughout the year.
Rainfall patterns in Ventura show some interesting trends. The city experiences the maximum rainfall, 1.34" (34mm), in January. In contrast, the driest periods are observed in May and June with a mere precipitation of 0.12" (3mm) and 0.24" (6mm) respectively. The number of rainfall days follows a similar pattern with the maximum of 6 days in March and a minimum of 2.1 days in August.
Other notable weather conditions include consistent visibility across all months at 6 miles, relatively moderate wind speed between 5mph (8km/h) to 7.1mph (11.4km/h), and steady pressure measurements within the 29.91" (760mm) to 30.11" (765mm) range.
The best time to visit Ventura
Ventura’s year-round mild and comfortable climate makes it a prime tourist choice irrespective of the season. However, taking into account the warm temperatures and lower rainfall, the months from May to August seem to be the most favorable for a visit. Temperatures during this period range from 63.1°F (17.3°C) to 74.3°F (23.5°C) paired with minimal rainfall, thus offering the best weather conditions for outdoor activities.The worst time to visit Ventura
While Ventura’s climate remains relatively stable throughout the year, visitors looking to avoid rainy days should consider foregoing the initial months of the year. Particularly, January holds the record for maximum rainfall of 1.34" (34mm), accompanied by relatively lower temperatures between 48.9°F (9.4°C) to 50.4°F (10.2°C).Spring weather in Ventura
Spring in Ventura is marked by gradually rising temperatures and diminishing rainfall. The average high temperatures range from 59°F (15°C) in February to 65.5°F (18.6°C) in April and the lows from 48.9°F (9.4°C) in February elevate to 54.5°F (12.5°C) in April. Meanwhile, rainfall demonstrates a considerable decrease from 1.22" (31mm) in February to a mere 0.24" (6mm) by the end of spring.Summer weather in Ventura
The summer months in Ventura begin with a bang as temperatures shoot up to around 69.1°F (20.6°C) in June and reach their zenith by August at 74.3°F (23.5°C). Rainfall during this period remains at a bare minimum, with a total precipitation of 0.12" (3mm) in June to 0.16" (4mm) in August. An increased daylight duration of approximately 14 hours contributes to making summer the best season to explore Ventura in all its glory.Autumn weather in Ventura
Autumn brings with it a slight dip in temperatures as quite naturally, the end of summer sets in. Ventura witnesses an average high of 70.5°F (21.4°C) in September which gradually cools down to 64.9°F (18.3°C) by November. Rainfall at this time ranges from 0.2" (5mm) in September and slightly increases to reach 0.39" (10mm) by November. Despite the drop in temperature, the overall climate remains comfortable for most outdoor activities.Winter weather in Ventura
The onset of winter witnesses a further decline in temperatures. December in Ventura sees an average high of 59.5°F (15.3°C) and an average low of 50°F (10°C). Interestingly, the rainfall increases notably to 1.14" (29mm) in December, signifying the start of the city’s wettest period which extends up to January. It is worth noting that despite the increased rainfall, Ventura maintains its moderately mild temperatures making its climate relatively favorable year-round.Weather in January
Ventura, Californian weather in January exhibits the month's coldest temperatures, with lows dipping to around 50.4°F (10.2°C) and highs barely reaching 60.4°F (15.8°C). Despite the drop in mercury, January remains a moderate month in terms of overall climatic conditions. Weather in January »Weather in February
As one moves into February, the chilly grasp of winter shows signs of wavering. Given a slight uptick in the average high temperature, Ventura feels a touch warmer than the preceding month. The rainfall also sees a decrease, indicative of the impending spring season. Weather in February »Weather in March
Ventura's March weather marks a distinct transition from winter to more Spring-like conditions. A noticeable shift towards sunnier conditions pervades, with the sunlight hours extending each day. Rainfall is slightly less, yet days when light showers accentuate the nurturing ambiance of spring can be observed often. Weather in March »Weather in April
As spring takes hold in April, the weather of Ventura, California, undergoes considerable transformation. The temperature gradually elevates, oscillating between captivating cool mornings and pleasantly warm afternoons. With an average rainfall of only 0.43" (11mm), the area experiences significantly drier conditions than previous months. Weather in April »Weather in May
May ushers in the quintessence of spring in Ventura. Weather modifications are distinguished by slightly warmer days and shrinking chances of precipitation. This change sets the stage for bright, clear skies that appear to stretch endlessly. Weather in May »Weather in June
June in Ventura marks the onset of summer. The longest day of the year falls in June, giving Ventura residents and visitors ample daylight for various outdoor activities. Although the city does not fully succumb to the oppressive heat typical of summer, the clear, sunny skies often compel locals to seek shade. Weather in June »Weather in July
July is the warmest month in Ventura, with the high temperature soaring to 74.3°F (23.5°C). The summer heat makes its presence strongly felt adding a certain languor to the afternoons. It, however, doesn't get uncomfortable as the nights are relatively cooler. Weather in July »Weather in August
Ventura’s August weather draws a lot of comparison with the previous month, July. It replicates its high temperatures and continues the trend of warm, dry, and sunny days. Worthy of note is the sea temperature, which peaks this month to a comfortable 64.1°F (17.8°C), attracting beach lovers and swimmers in throngs. Weather in August »Weather in September
As September rolls in, the Ventura climate starts experiencing changes signifying the advent of Autumn. The days continue to be warm yet start shortening noticeably as summer gracefully bows out. Cooler evenings creep in, suggesting the approaching fall. Weather in September »Weather in October
The moderating October weather in Ventura bears the mark of the transitioning fall season. As the days further shorten, the temperature meticulously starts its incremental descent towards cooler reads. The transition comes along with less rainfall and a further fall in humidity. Weather in October »Weather in November
By November, Ventura has fully embraced the fall season. The weather exhibits a gradual cool-down, reflecting the month's progress towards winter. The days continue to become shorter with less sunshine and slightly increased rainfall. Weather in November »Weather in December
In December, Ventura, California experiences the first touch of winter. Although the days continue to shorten and the temperature drops, the weather remains far from harsh. Compared to the sunnier months, December does have a larger share of overcast days yet the cloud cover often results in spectacular sunsets. Weather in December »Published by: Weather U.S. | About Us
Data Sources | Weather Forecasting & Climate
Frequently asked questions
Average temperature
Ventura, CA
The warmest months (with the highest average high temperature) are August and September (74.3°F).
The month with the lowest average high temperature is February (59°F).
The month with the highest average low temperature is August (62.6°F).
The coldest month (with the lowest average low temperature) is February (48.9°F).
Average pressure
Ventura, CA
- Average pressure in January:
30.11"Hg - Average pressure in February:
30.06"Hg - Average pressure in March:
30.05"Hg - Average pressure in April:
29.99"Hg - Average pressure in May:
29.95"Hg - Average pressure in June:
29.91"Hg
- Average pressure in July:
29.93"Hg - Average pressure in August:
29.91"Hg - Average pressure in September:
29.9"Hg - Average pressure in October:
29.96"Hg - Average pressure in November:
30.04"Hg - Average pressure in December:
30.08"Hg
The month with the highest atmospheric pressure is January (30.11"Hg).
The month with the lowest atmospheric pressure is September (29.9"Hg).
Average wind speed
Ventura, CA
- Average wind speed in January:
6.2mph - Average wind speed in February:
6.6mph - Average wind speed in March:
7mph - Average wind speed in April:
7.1mph - Average wind speed in May:
6.5mph - Average wind speed in June:
5.4mph
- Average wind speed in July:
5.2mph - Average wind speed in August:
5mph - Average wind speed in September:
5mph - Average wind speed in October:
5.7mph - Average wind speed in November:
6.3mph - Average wind speed in December:
6.5mph
The windiest month (with the highest average wind speed) is April (7.1mph).
The calmest months (with the lowest average wind speed) are August and September (5mph).
Average humidity
Ventura, CA
The months with the highest relative humidity are June and July (69%).
The month with the lowest relative humidity is November (56%).
Average rainfall
Ventura, CA
- Average rainfall in January:
1.34" - Average rainfall in February:
1.22" - Average rainfall in March:
1.18" - Average rainfall in April:
0.43" - Average rainfall in May:
0.24" - Average rainfall in June:
0.12"
- Average rainfall in July:
0.31" - Average rainfall in August:
0.16" - Average rainfall in September:
0.2" - Average rainfall in October:
0.24" - Average rainfall in November:
0.39" - Average rainfall in December:
1.14"
The wettest month (with the highest rainfall) is January (1.34").
The driest month (with the least rainfall) is June (0.12").
Average rainfall days
Ventura, CA
- Average rainfall days in January:
5.4 days - Average rainfall days in February:
5.3 days - Average rainfall days in March:
6 days - Average rainfall days in April:
4.6 days - Average rainfall days in May:
3.3 days - Average rainfall days in June:
2.2 days
- Average rainfall days in July:
4.2 days - Average rainfall days in August:
2.1 days - Average rainfall days in September:
3.1 days - Average rainfall days in October:
2.7 days - Average rainfall days in November:
3.4 days - Average rainfall days in December:
5.5 days
The month with the highest number of rainy days is March (6 days).
The month with the least rainy days is August (2.1 days).
Average sea temperature
Ventura, CA
The best month for swimming (with the highest average sea temperature) is August (64.1°F).
The coldest month (with the lowest average sea temperature) is April (56.7°F).
Average daylight / Average sunshine
Ventura, CA
- Average daylight in January:
10h and 12min - Average daylight in February:
11h and 0min - Average daylight in March:
12h and 0min - Average daylight in April:
13h and 6min - Average daylight in May:
14h and 0min - Average daylight in June:
14h and 24min
- Average daylight in July:
14h and 12min - Average daylight in August:
13h and 24min - Average daylight in September:
12h and 24min - Average daylight in October:
11h and 18min - Average daylight in November:
10h and 24min - Average daylight in December:
9h and 54min
The month with the longest days is June (Average daylight: 14h and 24min).
The month with the shortest days is December (Average daylight: 9h and 54min).
- Average sunshine in January:
6h and 48min - Average sunshine in February:
6h and 48min - Average sunshine in March:
8h and 54min - Average sunshine in April:
11h and 6min - Average sunshine in May:
11h and 42min - Average sunshine in June:
11h and 54min
- Average sunshine in July:
12h and 0min - Average sunshine in August:
12h and 0min - Average sunshine in September:
10h and 54min - Average sunshine in October:
8h and 18min - Average sunshine in November:
7h and 18min - Average sunshine in December:
6h and 48min
The months with the most sunshine are July and August (Average sunshine: 12h and 0min).
The months with the least sunshine are January, February and December (Average sunshine: 6h and 48min).
Average sunshine days
Ventura, CA
- Average sunshine days in January:
24.9 days - Average sunshine days in February:
21.5 days - Average sunshine days in March:
23.3 days - Average sunshine days in April:
24.3 days - Average sunshine days in May:
23.3 days - Average sunshine days in June:
21.3 days
- Average sunshine days in July:
20.4 days - Average sunshine days in August:
22.9 days - Average sunshine days in September:
21.5 days - Average sunshine days in October:
26 days - Average sunshine days in November:
25.8 days - Average sunshine days in December:
24.6 days
The month with the most sunshine days is October (26 days).
The month with the least sunshine days is July (20.4 days).
Average UV index
Ventura, CA
The month with the highest UV index is August (UV index 6).
The month with the lowest UV index is December (UV index 3).
Average cloud cover
Ventura, CA
The month with the most cloud cover is March (Cloud cover 22).
The month with the least cloud cover is August (Cloud cover 5).
Average visibility
Ventura, CA
The months with the highest visibility are January, February, March, April, May, June, July, August, September, October, November and December (6mi).
The months with the lowest visibility are January, February, March, April, May, June, July, August, September, October, November and December (6mi).


