October weather forecastVentura, CA
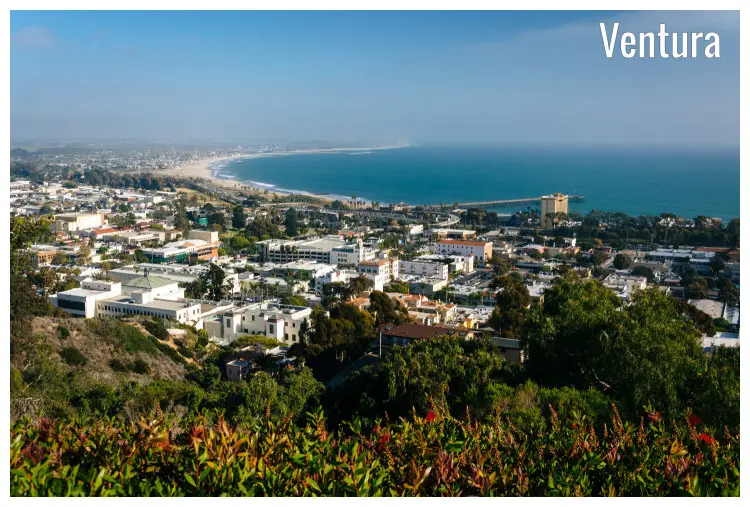
October
Weather in October
The moderating October weather in Ventura bears the mark of the transitioning fall season. As the days further shorten, the temperature meticulously starts its incremental descent towards cooler reads. The transition comes along with less rainfall and a further fall in humidity. However, the sun continues to bathe Ventura in its light, with clear skies typical of this month accentuating the autumn hues.Temperature
The initiation of October in Ventura records an average high-temperature of an agreeable 70.5°F (21.4°C), displaying a near consistency with the previous month. During October, an average low-temperature of 59°F (15°C) is observed.Humidity
In October, the average relative humidity is 59%.Rainfall
In Ventura, in October, during 2.7 rainfall days, 0.24" (6mm) of precipitation is typically accumulated. Throughout the year, in Ventura, there are 47.8 rainfall days, and 6.97" (177mm) of precipitation is accumulated.Ocean temperature
In Ventura, in October, the average water temperature is 61.9°F (16.6°C).Note: Most people do not enjoy swimming in water of 61.9°F (16.6°C). Breathing control becomes harder as the temperature descends from 69.8°F (21°C) to 59°F (15°C).
Daylight
In October, the average length of the day is 11h and 19min.On the first day of the month, sunrise is at 6:52 am and sunset at 6:40 pm. On the last day of October, sunrise is at 7:16 am and sunset at 6:04 pm PDT.
Sunshine
The average sunshine in October in Ventura is 8.3h.UV index
The average daily maximum UV index in October in Ventura is 5. A UV Index estimate of 3 to 5 represents a moderate threat to health from unprotected exposure to Sun's UV rays for the average person.Note: The maximum daily UV index of 5 in October interprets into the following recommendations:
Be careful. Light complexion individuals might get burns in fewer than 30 minutes. Considering the Sun's intensity during midday, it's wise to minimize direct exposure. A wide-brim hat offers excellent sun protection for the eyes, ears, face, and neck. Sunglasses with UVA and UVB protection significantly reduce eye damage from sun exposure.
Published by: Weather U.S. | About Us
Data Sources | Weather Forecasting & Climate
Frequently asked questions
Average temperature in October
Ventura, CA
- Average high temperature in October: 70.5°F
The warmest months (with the highest average high temperature) are August and September (74.3°F).
The month with the lowest average high temperature is February (59°F).
- Average low temperature in October: 59°F
The month with the highest average low temperature is August (62.6°F).
The coldest month (with the lowest average low temperature) is February (48.9°F).
Average pressure in October
Ventura, CA
- Average pressure in October: 29.96"Hg
The month with the highest atmospheric pressure is January (30.11"Hg).
The month with the lowest atmospheric pressure is September (29.9"Hg).
Average wind speed in October
Ventura, CA
- Average wind speed in October: 5.7mph
The windiest month (with the highest average wind speed) is April (7.1mph).
The calmest months (with the lowest average wind speed) are August and September (5mph).
Average humidity in October
Ventura, CA
- Average humidity in October: 59%
The months with the highest relative humidity are June and July (69%).
The month with the lowest relative humidity is November (56%).
Average rainfall in October
Ventura, CA
- Average rainfall in October: 0.24"
The wettest month (with the highest rainfall) is January (1.34").
The driest month (with the least rainfall) is June (0.12").
Average rainfall days in October
Ventura, CA
- Average rainfall days in October: 2.7 days
The month with the highest number of rainy days is March (6 days).
The month with the least rainy days is August (2.1 days).
Average sea temperature in October
Ventura, CA
- Average sea temperature in October: 62°F
The best month for swimming (with the highest average sea temperature) is August (64.1°F).
The coldest month (with the lowest average sea temperature) is April (56.7°F).
Average daylight in October /
Average sunshine in October
Ventura, CA
- Average daylight in October: 11h and 18min
The month with the longest days is June (Average daylight: 14h and 24min).
The month with the shortest days is December (Average daylight: 9h and 54min).
- Average sunshine in October: 8h and 18min
The months with the most sunshine are July and August (Average sunshine: 12h and 0min).
The months with the least sunshine are January, February and December (Average sunshine: 6h and 48min).
Average sunshine days in October
Ventura, CA
- Average sunshine days in October: 26 days
The month with the most sunshine days is October (26 days).
The month with the least sunshine days is July (20.4 days).
Average UV index in October
Ventura, CA
- Average UV index in October: 5
The month with the highest UV index is August (UV index 6).
The month with the lowest UV index is December (UV index 3).
Average cloud cover in October
Ventura, CA
- Average cloud cover in October: 9
The month with the most cloud cover is March (Cloud cover 22).
The month with the least cloud cover is August (Cloud cover 5).
Average visibility in October
Ventura, CA
- Average visibility in October: 6mi
The months with the highest visibility are January, February, March, April, May, June, July, August, September, October, November and December (6mi).
The months with the lowest visibility are January, February, March, April, May, June, July, August, September, October, November and December (6mi).


