June weather forecastVentura, CA
June
Weather in June
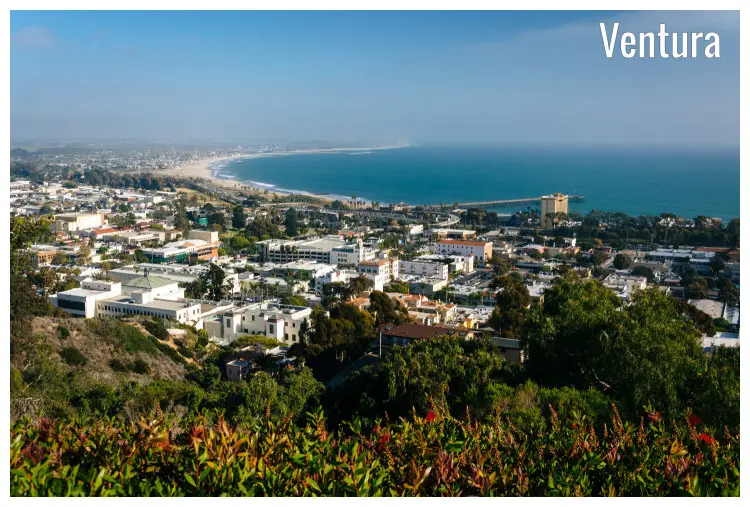
June in Ventura marks the onset of summer. The longest day of the year falls in June, giving Ventura residents and visitors ample daylight for various outdoor activities. Although the city does not fully succumb to the oppressive heat typical of summer, the clear, sunny skies often compel locals to seek shade. Still, relief can be found in the cool evening breeze that gently sways the palm trees marking the Ventura landscape.Temperature
June's arrival in Ventura registers an average high-temperature of a pleasant 69.1°F (20.6°C), closely aligning with the temperature of the previous month. During the month of June, the temperature in Ventura generally drops to a low average of 58.1°F (14.5°C).Humidity
June and July, with an average relative humidity of 69%, are the most humid months in Ventura.Rainfall
June is the month with the least rainfall. Rain falls for 2.2 days and accumulates 0.12" (3mm) of precipitation.Ocean temperature
In June, the average ocean temperature is 60.4°F (15.8°C).Note: Swimming is not a pleasant activity for most individuals in 60.4°F (15.8°C). Breathing becomes increasingly challenging to control as the water temperature dips from 69.8°F (21°C) to 59°F (15°C).
Daylight
The month with the longest days in Ventura is June, with an average of 14h and 24min of daylight.On the first day of June in Ventura, sunrise is at 5:45 am and sunset at 8:04 pm. On the last day of the month, sunrise is at 5:48 am and sunset at 8:13 pm PDT.
Sunshine
The average sunshine in June in Ventura is 11.9h.UV index
In June, the average daily maximum UV index in Ventura is 5. A UV Index reading of 3 to 5 represents a moderate threat to health from exposure to the Sun's UV radiation for ordinary individuals.Note: In June, an average UV index of 5 transforms into the following instructions:
Make use of precautions - Suggestions to resist sunburn are communicated. The Sun's radiation is especially intense around midday; try to stay in shade during this period. Experience reduced UV exposure by about half when donning a wide-brim hat.
Published by: Weather U.S. | About Us
Data Sources | Weather Forecasting & Climate
Frequently asked questions
Average temperature in June
Ventura, CA
- Average high temperature in June: 69.1°F
The warmest months (with the highest average high temperature) are August and September (74.3°F).
The month with the lowest average high temperature is February (59°F).
- Average low temperature in June: 58.1°F
The month with the highest average low temperature is August (62.6°F).
The coldest month (with the lowest average low temperature) is February (48.9°F).
Average pressure in June
Ventura, CA
- Average pressure in June: 29.91"Hg
The month with the highest atmospheric pressure is January (30.11"Hg).
The month with the lowest atmospheric pressure is September (29.9"Hg).
Average wind speed in June
Ventura, CA
- Average wind speed in June: 5.4mph
The windiest month (with the highest average wind speed) is April (7.1mph).
The calmest months (with the lowest average wind speed) are August and September (5mph).
Average humidity in June
Ventura, CA
- Average humidity in June: 69%
The months with the highest relative humidity are June and July (69%).
The month with the lowest relative humidity is November (56%).
Average rainfall in June
Ventura, CA
- Average rainfall in June: 0.12"
The wettest month (with the highest rainfall) is January (1.34").
The driest month (with the least rainfall) is June (0.12").
Average rainfall days in June
Ventura, CA
- Average rainfall days in June: 2.2 days
The month with the highest number of rainy days is March (6 days).
The month with the least rainy days is August (2.1 days).
Average sea temperature in June
Ventura, CA
- Average sea temperature in June: 60.4°F
The best month for swimming (with the highest average sea temperature) is August (64.1°F).
The coldest month (with the lowest average sea temperature) is April (56.7°F).
Average daylight in June /
Average sunshine in June
Ventura, CA
- Average daylight in June: 14h and 24min
The month with the longest days is June (Average daylight: 14h and 24min).
The month with the shortest days is December (Average daylight: 9h and 54min).
- Average sunshine in June: 11h and 54min
The months with the most sunshine are July and August (Average sunshine: 12h and 0min).
The months with the least sunshine are January, February and December (Average sunshine: 6h and 48min).
Average sunshine days in June
Ventura, CA
- Average sunshine days in June: 21.3 days
The month with the most sunshine days is October (26 days).
The month with the least sunshine days is July (20.4 days).
Average UV index in June
Ventura, CA
- Average UV index in June: 5
The month with the highest UV index is August (UV index 6).
The month with the lowest UV index is December (UV index 3).
Average cloud cover in June
Ventura, CA
- Average cloud cover in June: 9
The month with the most cloud cover is March (Cloud cover 22).
The month with the least cloud cover is August (Cloud cover 5).
Average visibility in June
Ventura, CA
- Average visibility in June: 6mi
The months with the highest visibility are January, February, March, April, May, June, July, August, September, October, November and December (6mi).
The months with the lowest visibility are January, February, March, April, May, June, July, August, September, October, November and December (6mi).


